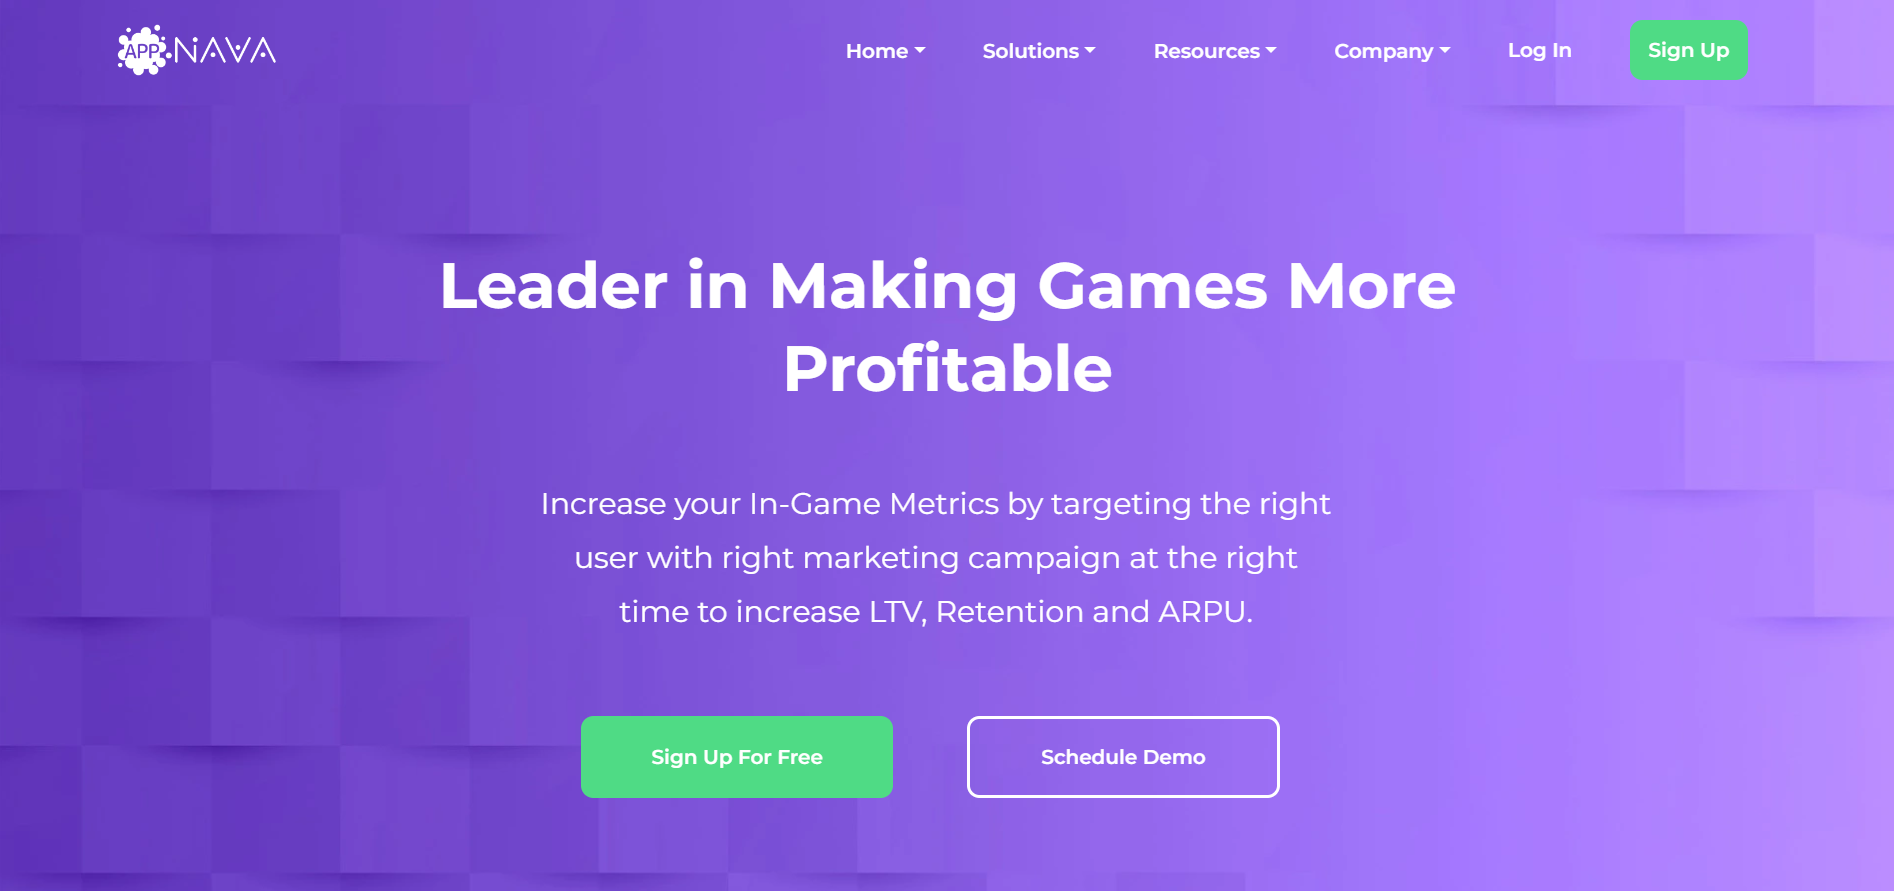
AppNava was founded back in 2019 to make apps and games richer and happier. We are a team of four awesome tech and mobile data experts who aspire to bring a revolution to the mobile and digital world. Data-driven solutions and machine learning utilization just run in our blood! This team of four excels at modelling complex user behaviours for mobile apps and predicting the future of your customers. With our experience in data science and engineering, we are putting forth our best to make you thrive. After a year of model development, we are happy to be there for mobile apps and games with data driven insights.
Understand and analyze the what, when and why of your users' behaviour. Understand the past; what happened and why! At this stage, machine learning algorithms start being trained.
Predict Next Behaviour
Start predicting how your users will behave in the future even they don't know yet. Our registered machine learning algorithms predict user behavior. AppNava allows you to understand your users much more deeper.
Take Right Actions
Everyone is different in many ways; tastes, lifestyles, expectations… Showing the same offer to everybody does not make sense. Personalize your campaign and game regarding this knowledge.
Connect to the largest mobile ecosystem with integrated partners globally. Just select your analytics partners and measurement tools (AWS, Google Analytics, Game Analytics, etc.). Then, on the receiving side, choose the API that works for you to get access to your data, all of the time. With completed API connection, the mapping system is working to choose the required features/variables from your raw data. Here 80% match is enough to continue to the next steps.
For next steps you can go to this How it Works page to learn more!
In this section you can learn about what are our resources and how to use them
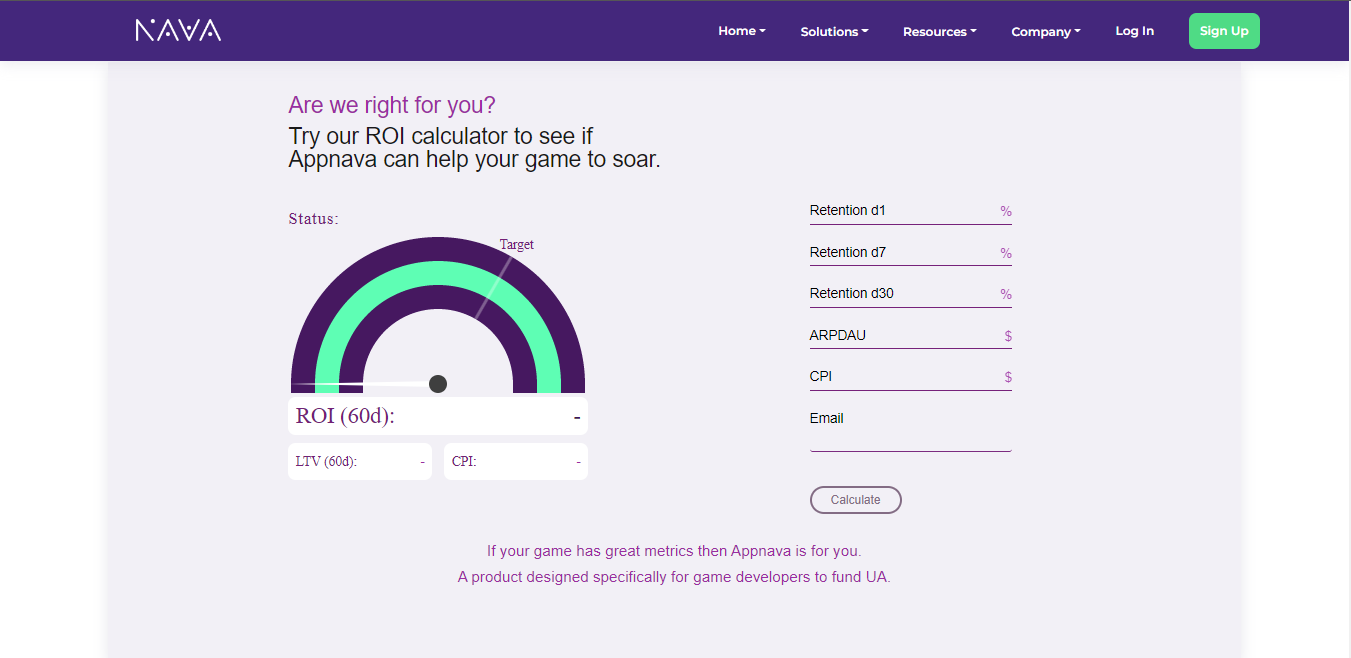
ROI and ROAS Calculator
Learn what ROI and ROAS are and how to use the calculator!
ROI definition
ROI stands for “Return on Investment.” Essentially, it’s a measurement of the return on a particular investment, relative to the cost of the investment. In other words, it’s a ratio between your net profit and investment. There’s a simple formula that you can use to work out the ROI: ROI = (Net Profit / Net Spend) x 100
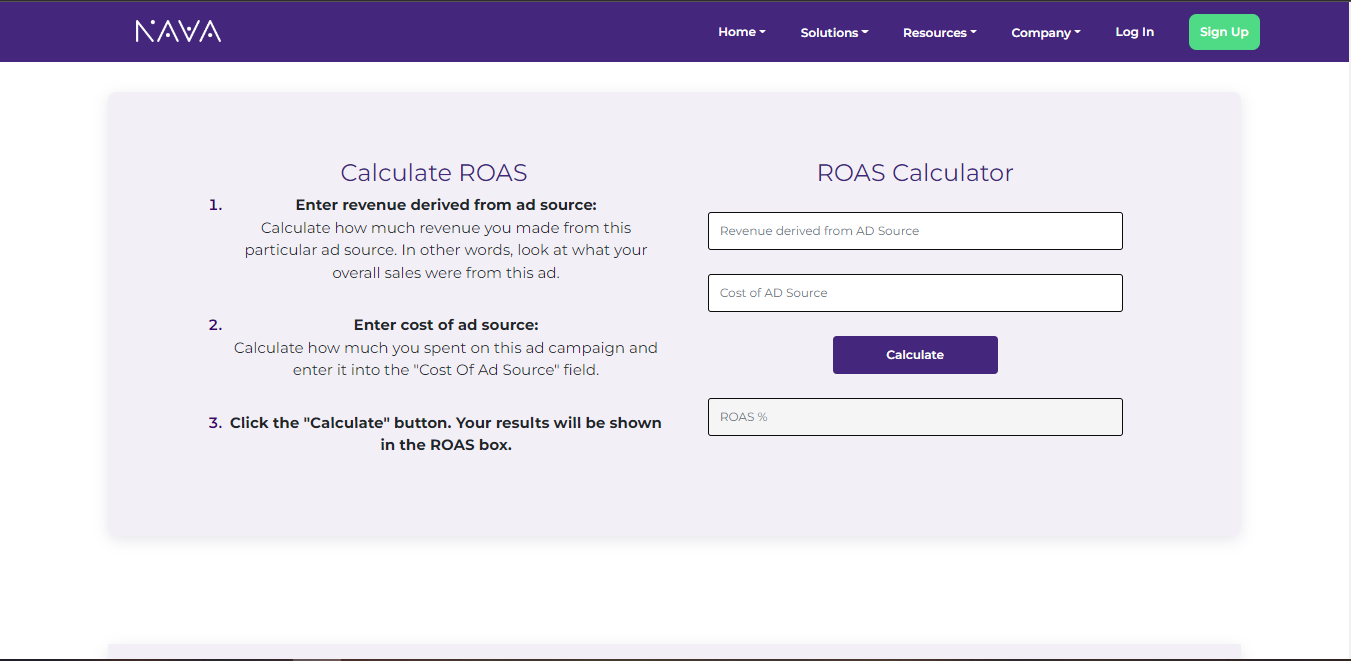
ROAS definition
ROAS stands for “Return on Ad Spend.” ROAS can help you determine the efficiency of your online advertising campaigns by calculating the amount of money your business earns for each pound it spends on advertising. You can use the following formula to calculate ROAS: ROAS = (Revenue Generated from Ads / Advertising Spend) x 100.
The difference between ROI and ROAS
When it comes to ROI vs. ROAS, there are a couple of major differences. Firstly, ROAS looks at revenue, rather than profit. Secondly, ROAS only considers direct spend, rather than other costs associated with your online campaign. In a nutshell, ROAS is the best metric to look at for determining whether your ads are effective at generating clicks, impressions, and revenue. However, unlike ROI, it won’t tell you whether your paid advertising effort is actually profitable for the company.
Should I use ROI or ROAS?
When you consider ROI vs. ROAS, it’s important to remember that it isn’t an either/or situation. Whereas ROI can help you understand long-term profitability, ROAS may be more suited to optimising short-term strategy. To craft an effective digital marketing campaign, you’ll need to utilise both the ROI and ROAS formulas. ROI provides you with insight into the overall profitability of your advertising campaign, while ROAS can be used to identify specific strategies that can help you improve your online marketing efforts and generate clicks and revenue.
Tip
AppNava helps you automate payment collection, cutting down on the amount of admin your team needs to deal with when chasing invoices. You can go this page and try our ROI and Roas Calculator!
Do you want to know about the titles of the fields you need to enter into the calculator?
Read below for more info!
LTV
LTV is lifetime value. This is the estimated value that you expect to extract from the player. It makes more sense to couple this lifetime value with a number of days during which the user interacts with the product (the game in this case). This enables us to study whether we are on the right track, and to reason about the product. So, LTV365 is the expected (read average) value or revenue we get from a player after 365 days or 1 year after coming into contact with the game for the first time.
Retention
Retention is a measure that will tell us how the players will keep interacting with the game. Day 1 retention (D1), is a percentage of how many players returned to the game after launching it for the first time (D0). The higher the retention, the better because it means that players keep coming back, so there is something about the product/game/app that motivated them to return.
ARPDAU
ARPDAU is average revenue per daily active user. This metric is very convoluted. By itself, it doesn’t say much. An ARPDAU of 2€ says very little. If you have a restaurant and DAU (daily active user), is the number of customers that walk in, 2€ ARPDAU might leave you bankrupt. For a mobile game, if you create a compelling title where on average you get 2€ per daily active user then you might have struck gold.
CPI
CPI is the cost per install. Lately, User Acquisition (UA), is an integral part of the business model of scaling F2P mobile games. And with more and more publishers paying to acquire users, the market is getting more and more competitive, and the cost per install and acquiring a new player is going through the roof.
UA
So User Acquisition works just like the old fashioned advertisements. You pay upfront, to get customers/players/users walking in, and hopefully, those that convert (end up buying something), will make up for the price of the advertisement and yield some extra revenue. So it’s an upfront investment and in order to minimize the risks associated with this investment, we have to study and predict how we will make the money back with a profit.
B. Getting Started
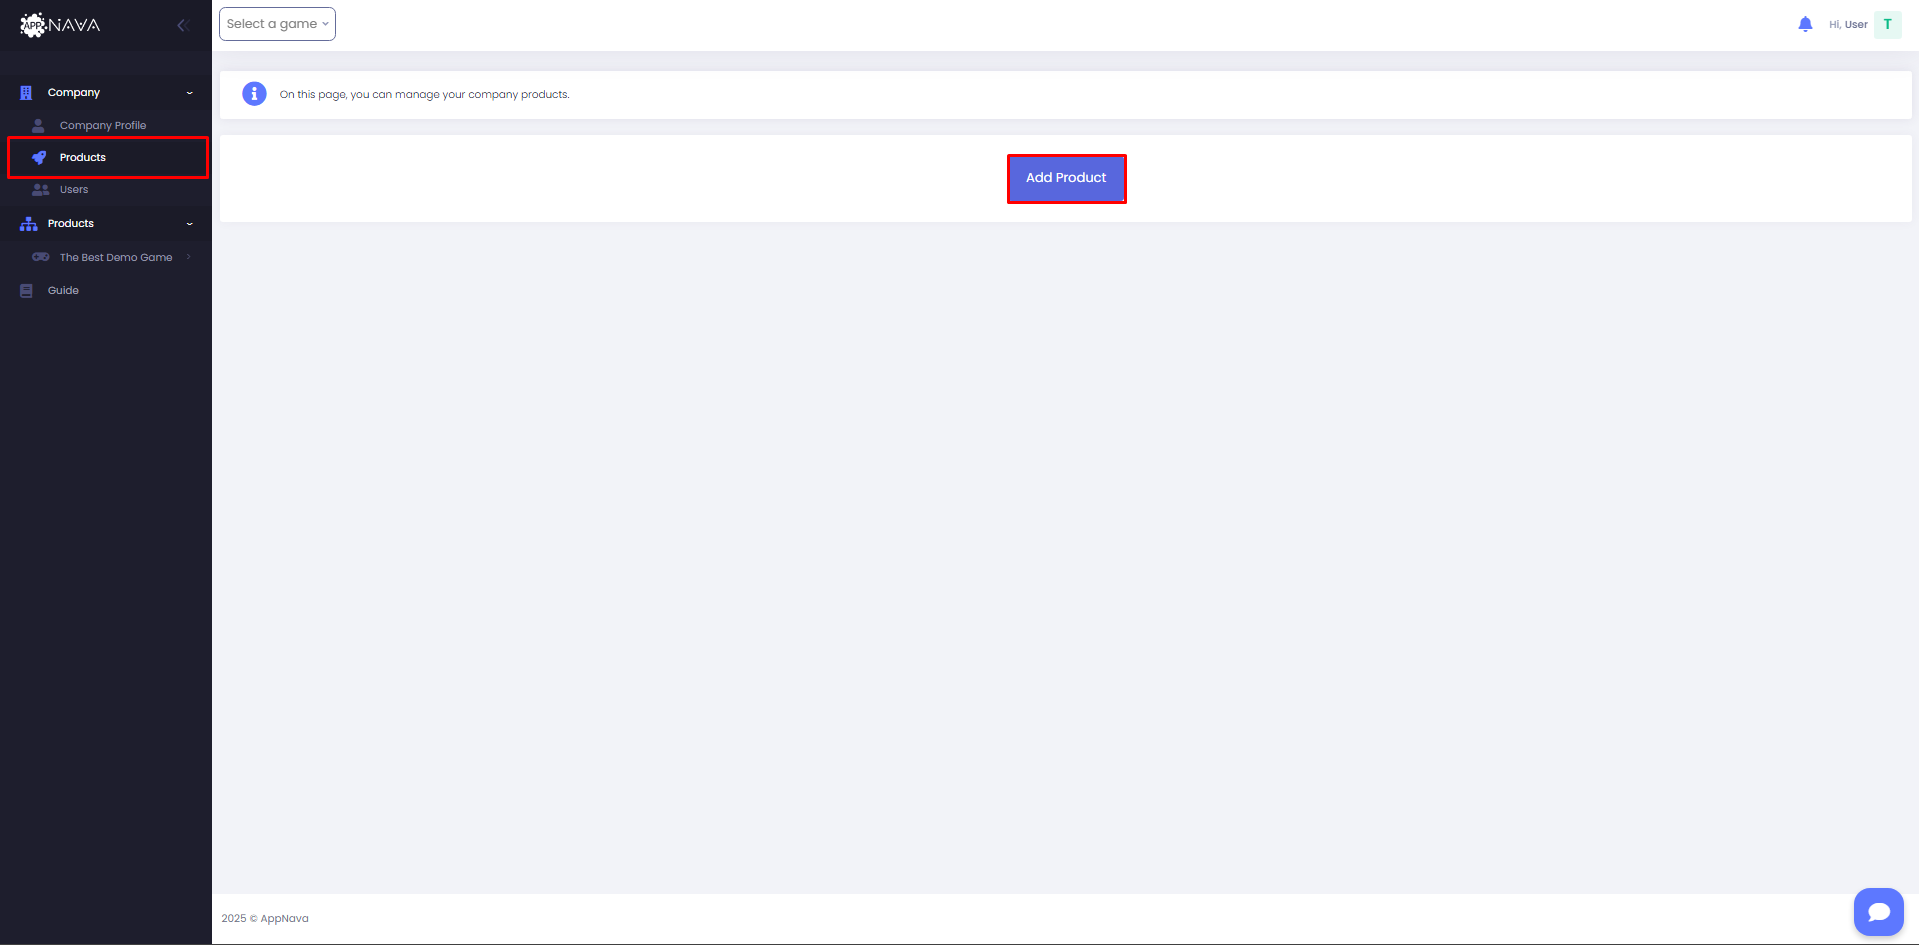
Welcome to AppNava! This guide will help you get started quickly so you can begin exploring business data, setting up dashboards, and sharing insights across your team.
Before adding a product, ensure you have granted the necessary database access permissions — for example, access to your BigQuery project, AWS S3 bucket, Snowflake table, or Redshift materialized view. These permissions allow AppNava to securely access your game/app data for integration.
Specific setup instructions are provided in Integration section.
Description: Optional. Brief description of the product.
3
Product Icon: Required. Click the icon field to select an icon.
4
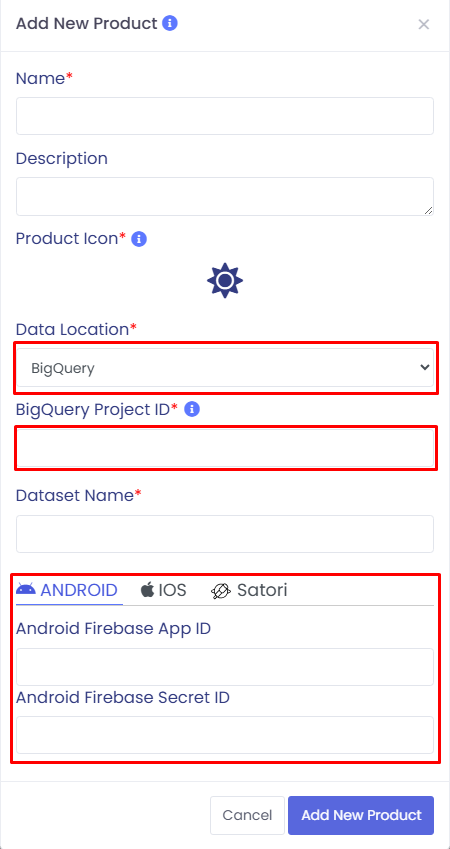
Data Location: Required. Choose BigQuery from the dropdown.
5
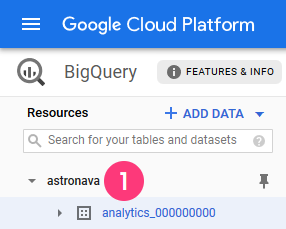
BigQuery Project ID: Required. You can find your Project ID in the Google BigQuery Console. Use the format project-name-123456 (lowercase, hyphenated).
6
Dataset Name: Required. Enter the dataset name associated with your BigQuery data.
7
Backend Integration (Optional but Recommended)
If you plan to use prediction with Firebase or Satori, it’s recommended to provide the following:
Firebase: Enter Android/iOS Firebase App ID and Secret ID in the related tabs.
Satori: Provide Server Key and Server URL in the Satori tab.
1
Name: Required. Name of your product.
2
Description: Optional. Brief description of the product.
3
Product Icon: Required. Click the icon field to select an icon.
4
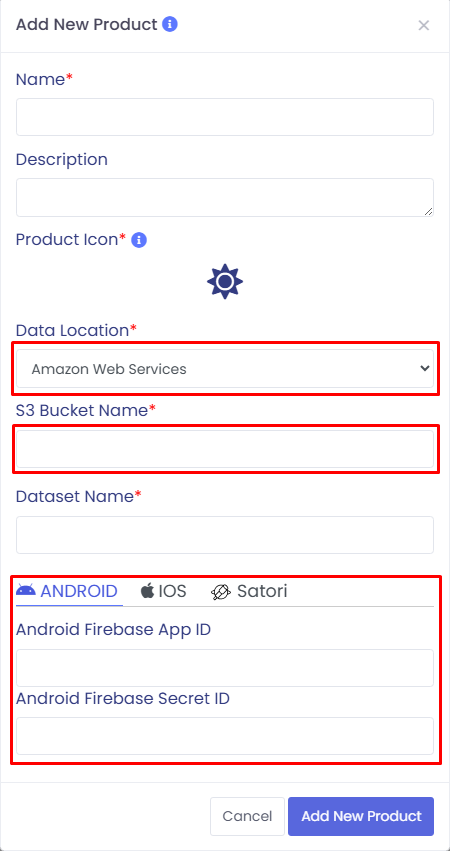
Data Location: Required. Choose AWS from the dropdown.
5
S3 Bucket Name: Required for AWS.
You can find this in your AWS S3 Console.
6
Backend Integration (Optional but Recommended)
If you plan to use prediction with Firebase or Satori, it’s recommended to provide the following:
Firebase: Enter Android/iOS Firebase App ID and Secret ID in the related tabs.
Satori: Provide Server Key and Server URL in the Satori tab.
1
Name: Required. Name of your product.
2
Description: Optional. Brief description of the product.
3
Product Icon: Required. Click the icon field to select an icon.
4
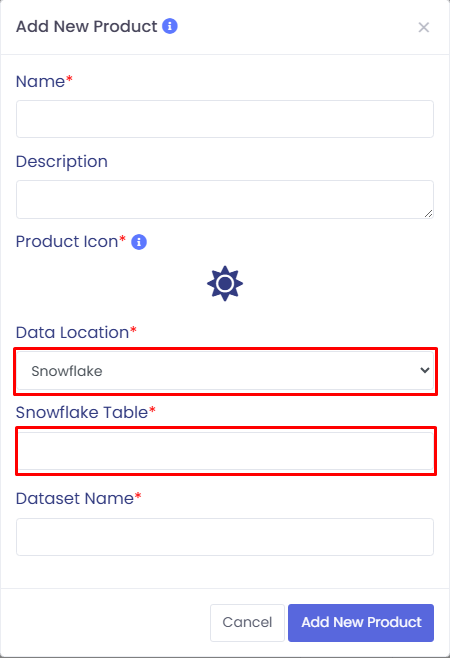
Data Location: Required. Choose Snowflake from the dropdown.
5
Snowflake Table: Required for Snowflake.
Provide the full table name (e.g., DB.SCHEMA.TABLE).
You can locate the correct table by logging into your Snowflake UI.
6
Backend Integration (Optional but Recommended)
If you plan to use prediction with Firebase or Satori, it’s recommended to provide the following:
Firebase: Enter Android/iOS Firebase App ID and Secret ID in the related tabs.
Satori: Provide Server Key and Server URL in the Satori tab.
1
Name: Required. Name of your product.
2
Description: Optional. Brief description of the product.
3
Product Icon: Required. Click the icon field to select an icon.
4
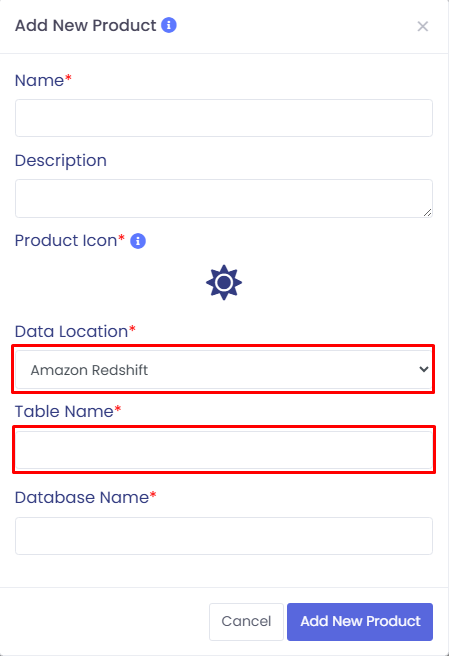
Data Location: Required. Choose Redshift from the dropdown.
5
Redshift Table Name: Required for Redshift.
You can retrieve this from your Redshift Console.
6
Backend Integration (Optional but Recommended)
If you plan to use prediction with Firebase or Satori, it’s recommended to provide the following:
Firebase: Enter Android/iOS Firebase App ID and Secret ID in the related tabs.
Satori: Provide Server Key and Server URL in the Satori tab.
If your product uses a data source not listed above, such as a private server, third-party database, or any other custom integration, select "Other" from the Data Location dropdown while adding your product.
Please Contact Us so we can assist you with the integration process and ensure everything is set up correctly for analysis.
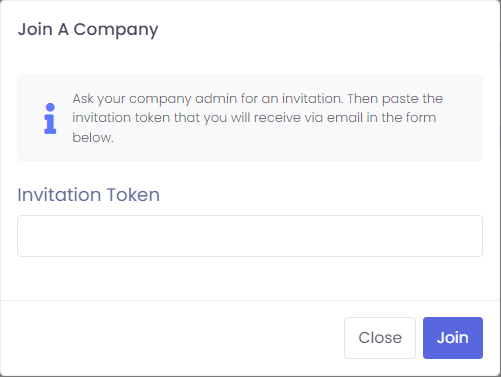
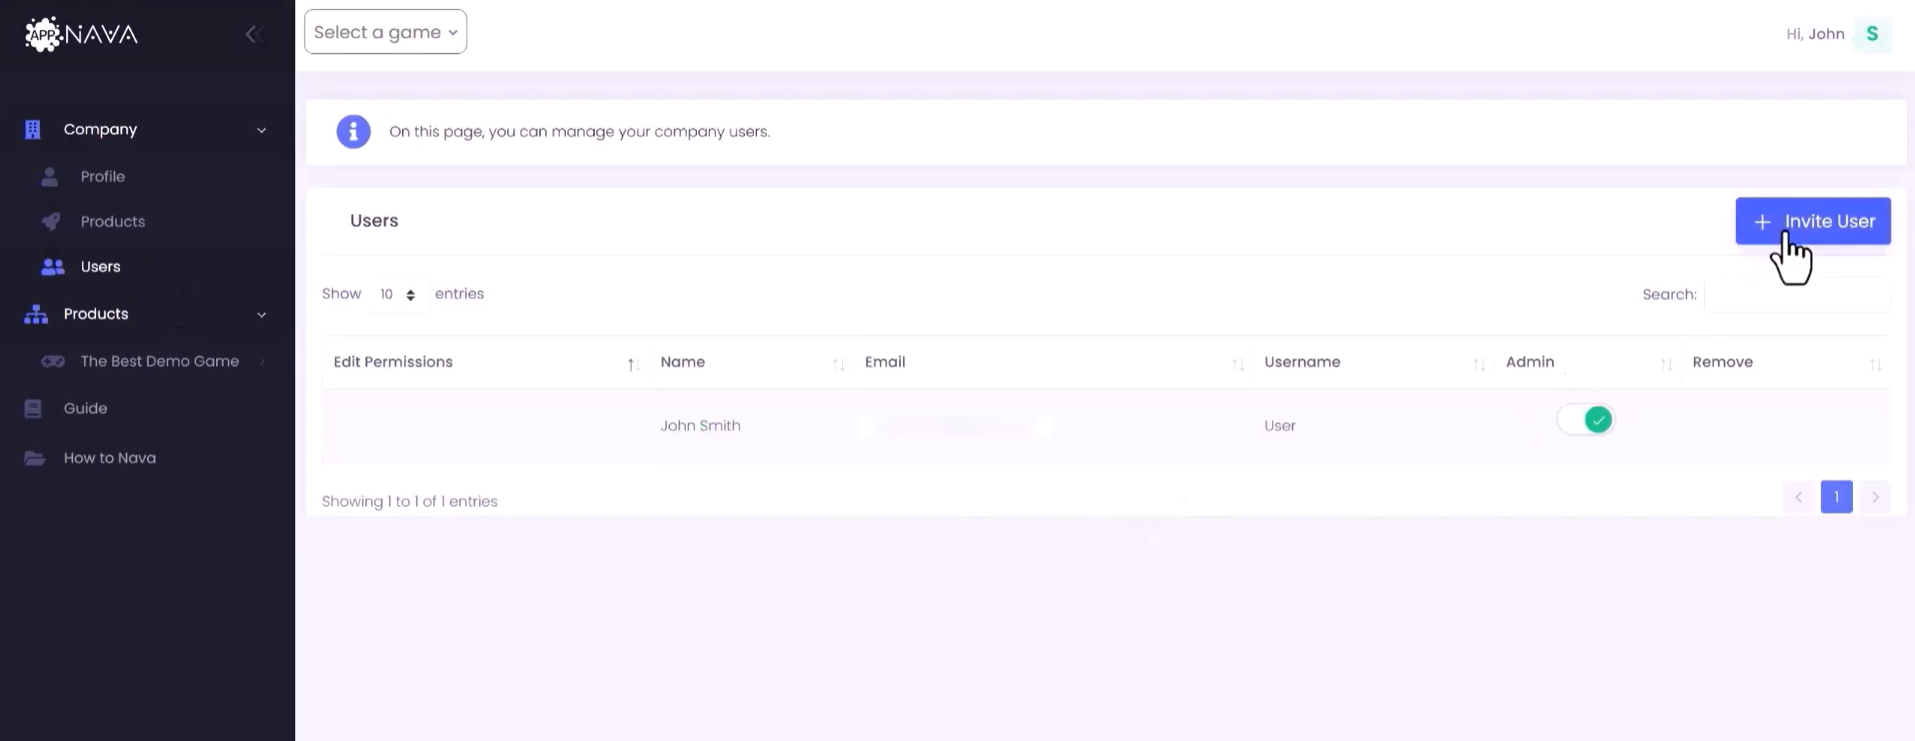
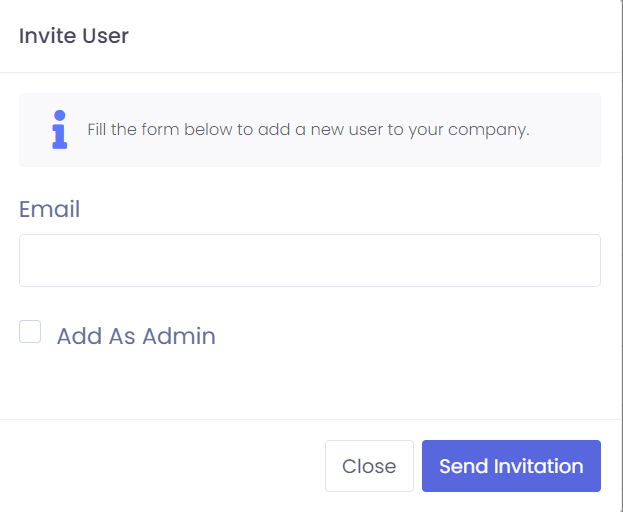
Go to Users page on the dashboard and click Invite User
Enter the email address of the person you want to invite and click Send Invitation
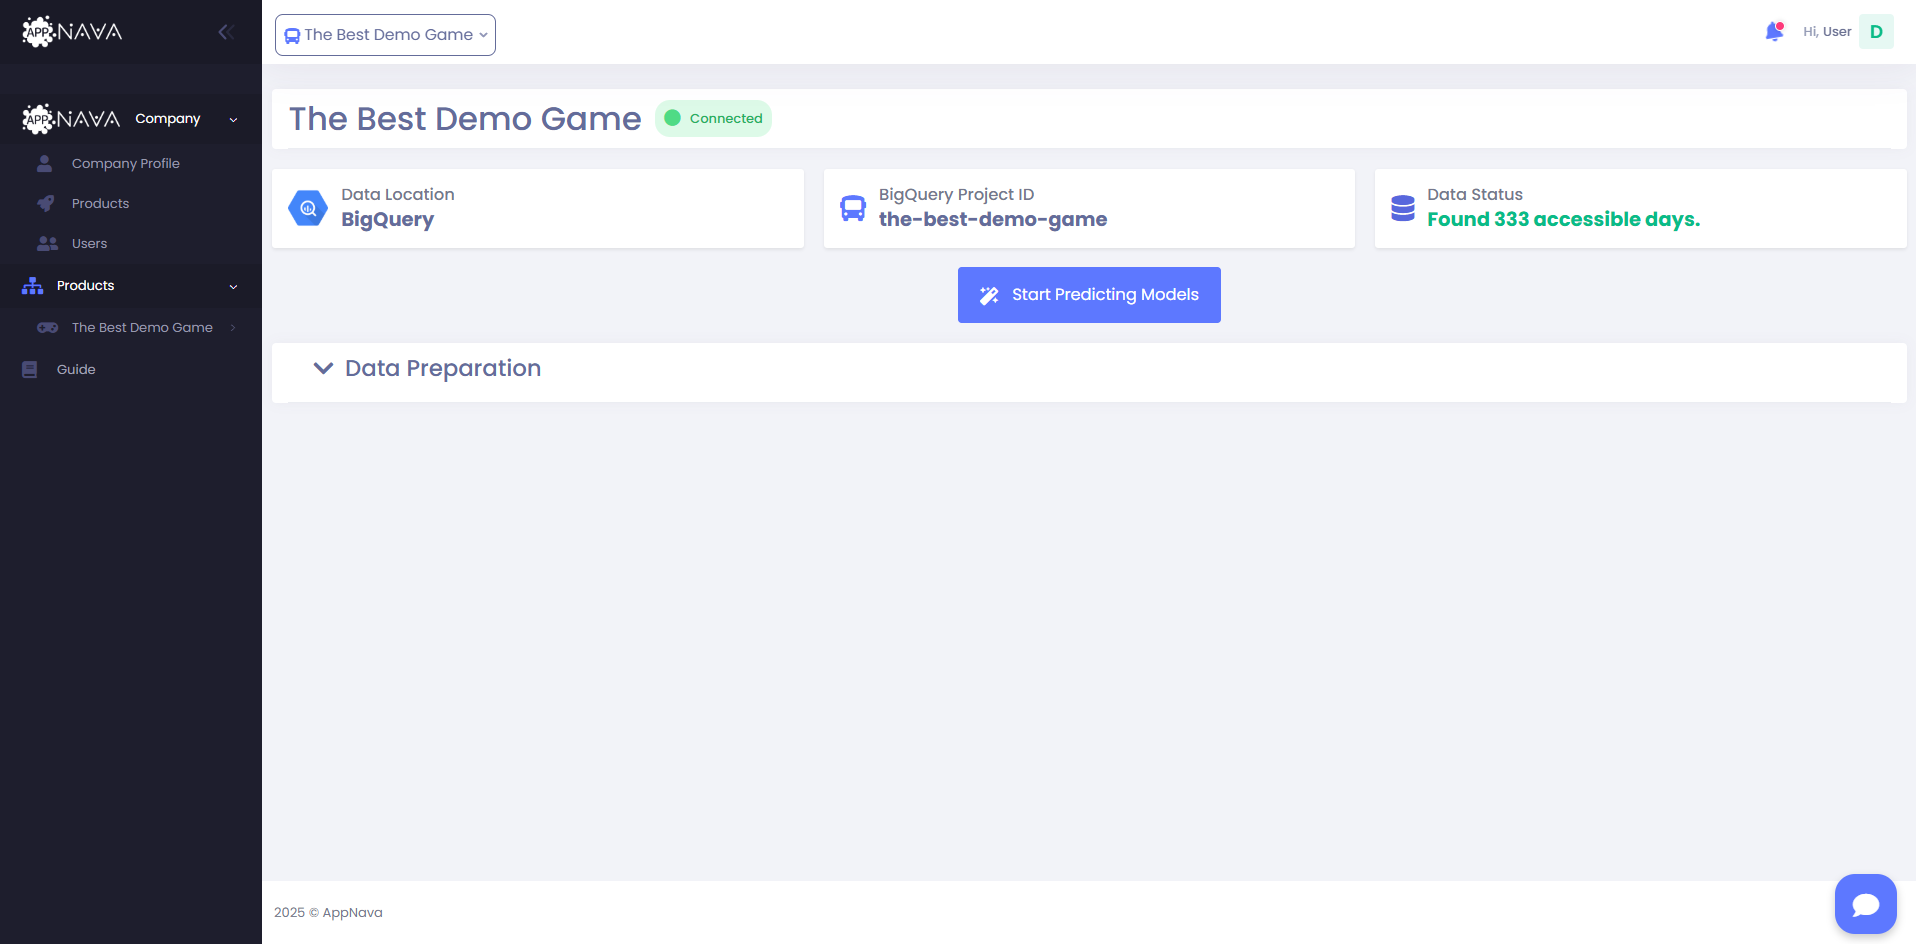
C. Setup Machine Learning Models
1
Go to Data Operations Page
2
Click Start Predicting Models button
3
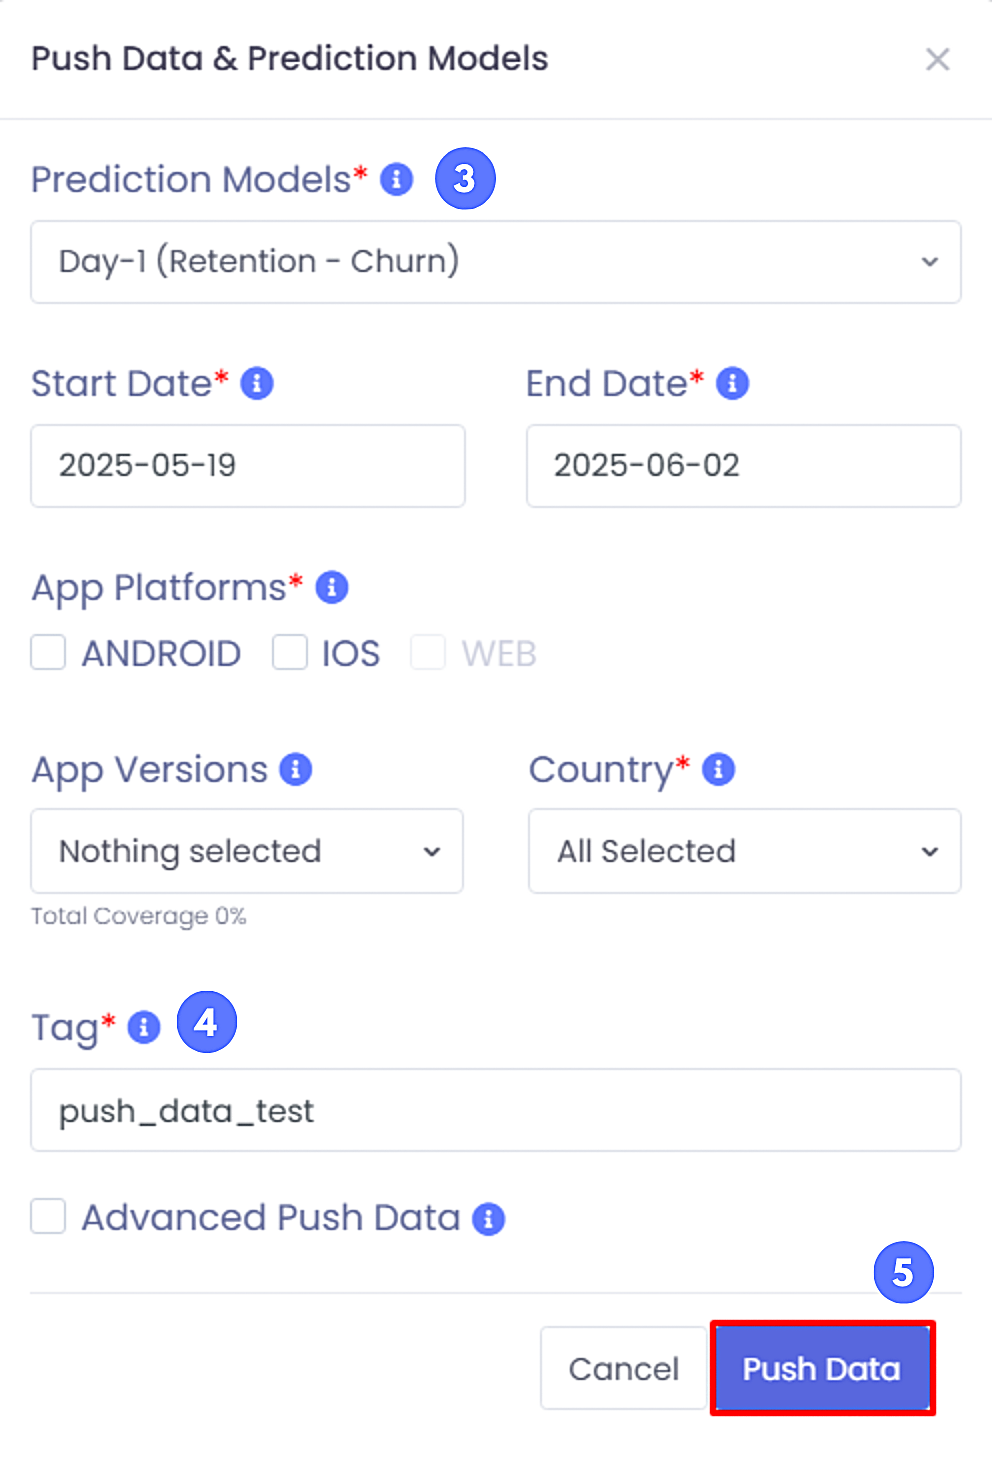
Check the models you want to use (For more information about models, check Guides > Prediction Models page)
4
Write a tag for the dataset
5
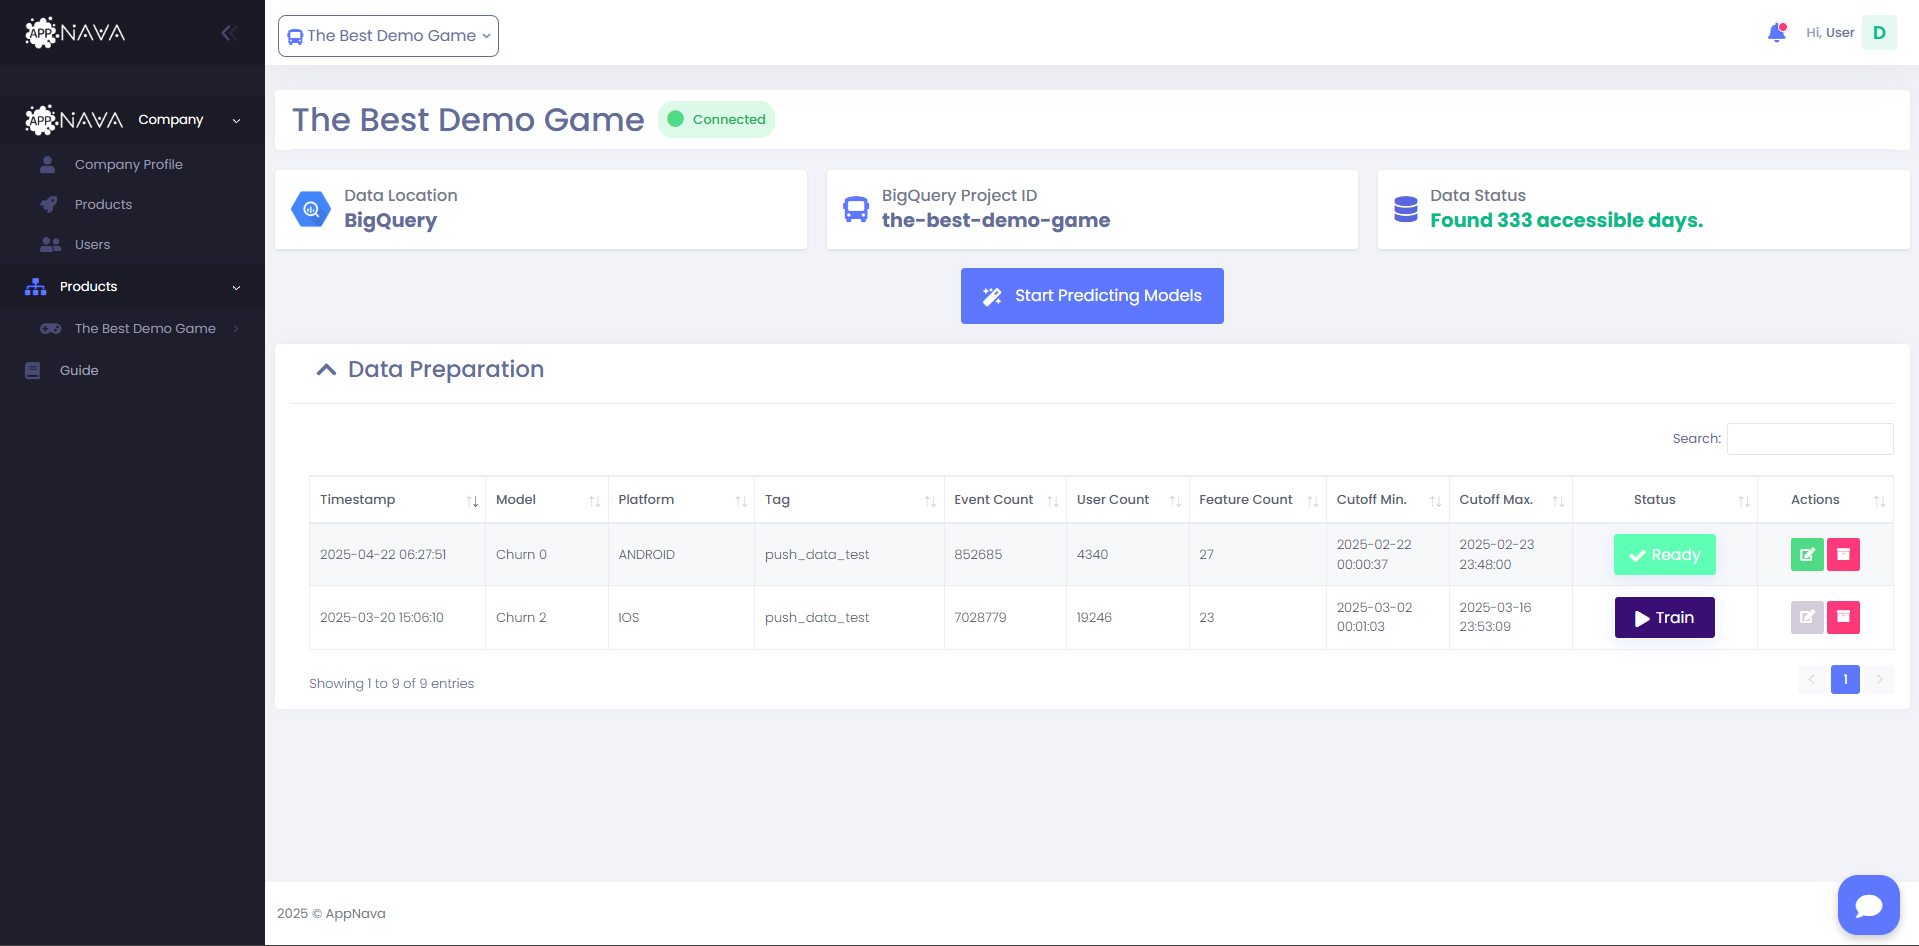
When you click the Push Data button, a separate entry will be added to the Data Preparation table for each model you have selected.
We will be notified and start working on your models
When your models are ready, you will be notified by e-mail
Note
Usually a dataset of 1.000.000 events and 30.000 distinct users is needed for the models to be working. We will find the time-point after which these numbers are met and update the associated columns.
D. Setup Real-Time Predictions
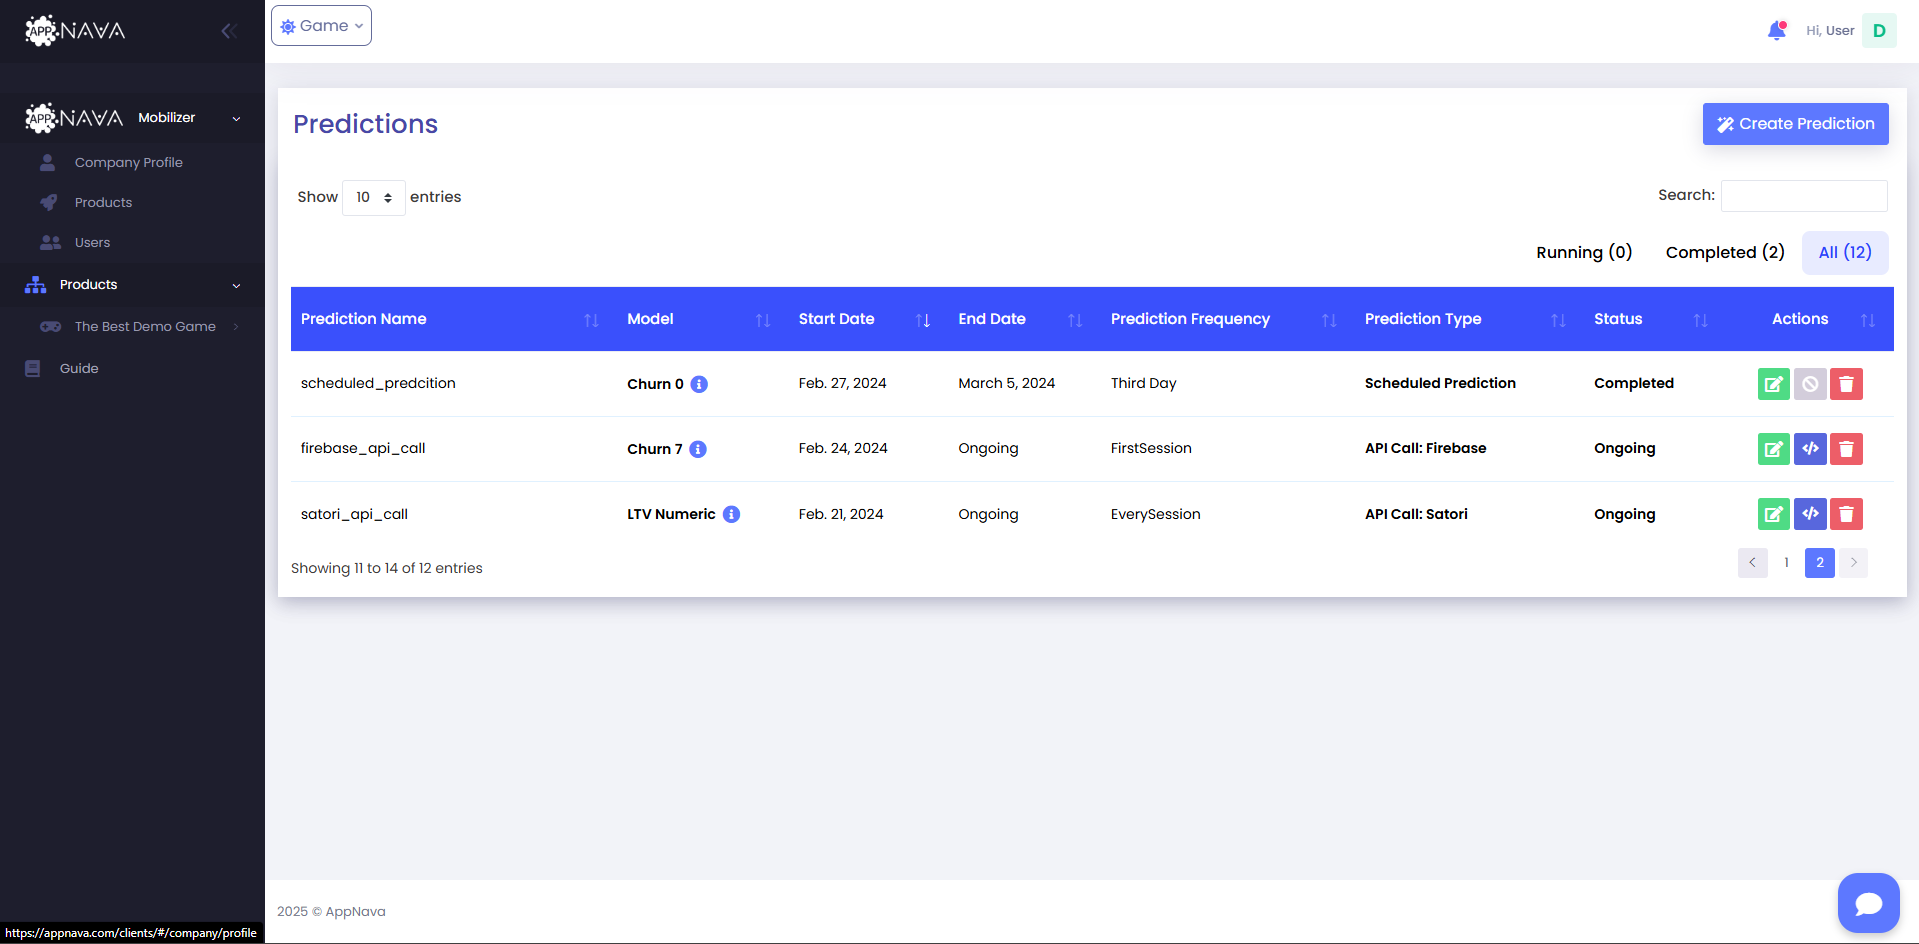
After the model has been trained, you will be able to create the ready-to-use models in Predictions Page
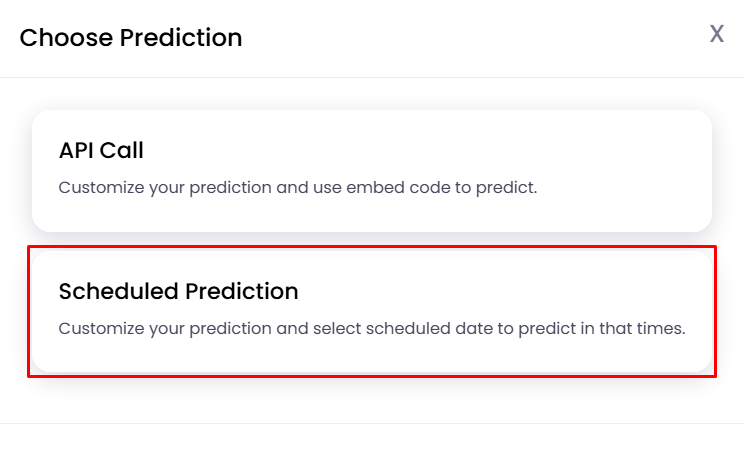
You can create a prediction by clicking Create Prediction button and select prediction option.
There are three ways for carrying out predictions:
API Call
Scheduled Prediction
Instant Prediction
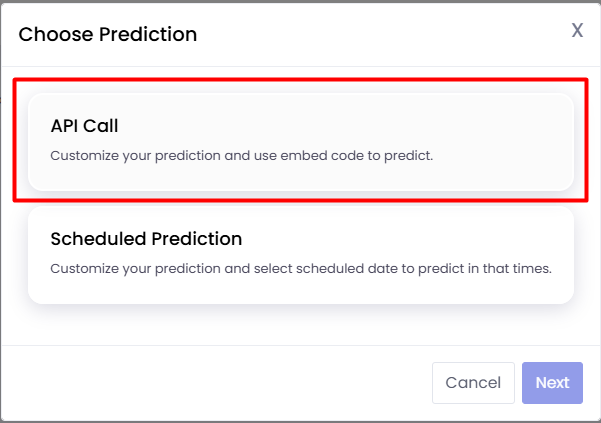
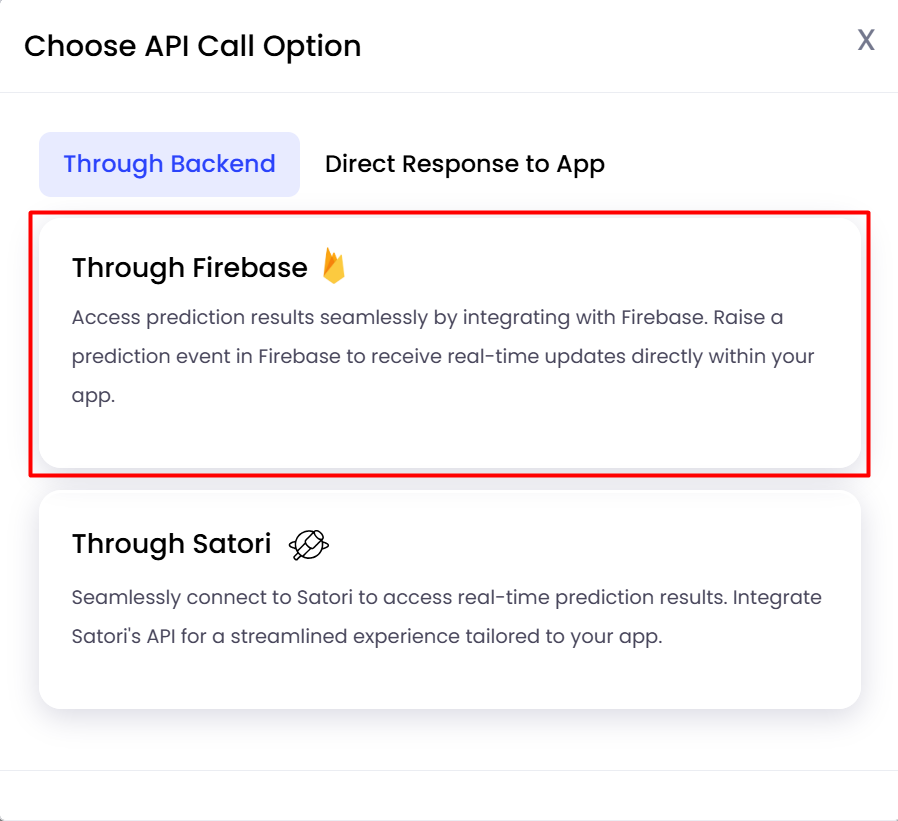
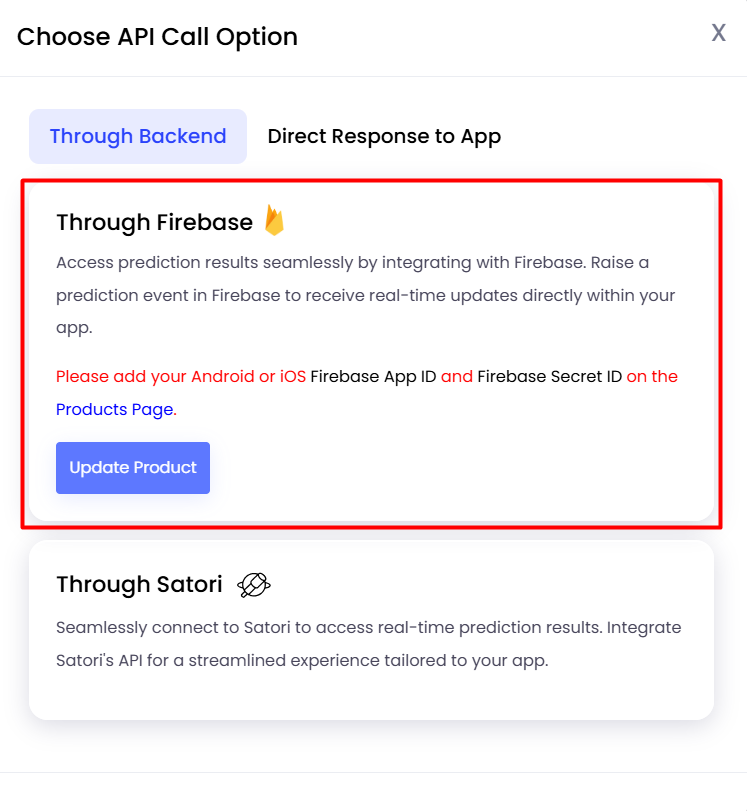
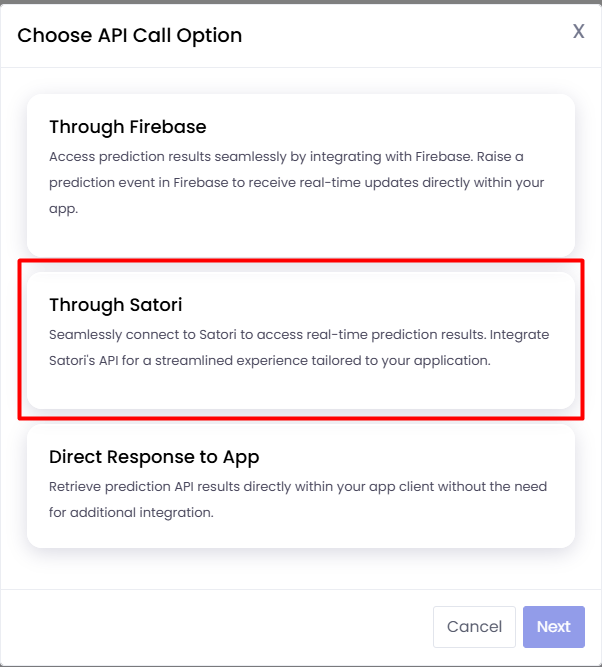
Choosing API Call presents three options:
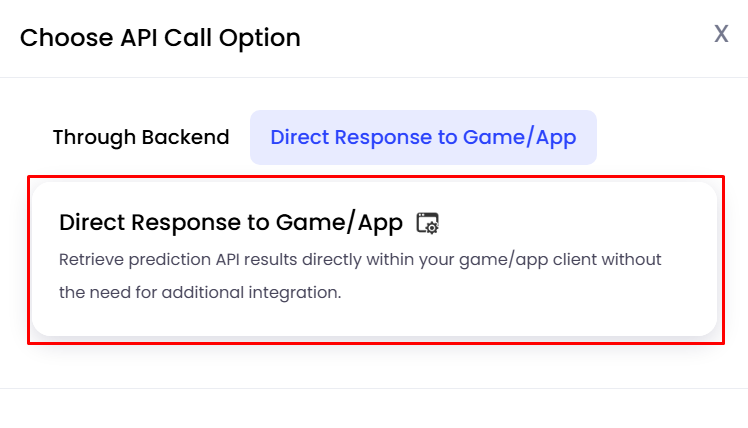
Direct Response to Game/App: The api can be invoked directly inside the game client and the results can be collected without any additional integration.
Through Firebase: Requires Firebase measurement API integration.
Through Satori: Requires Satori measurement API integration.
You can select the “Direct Response to Game/App” option.
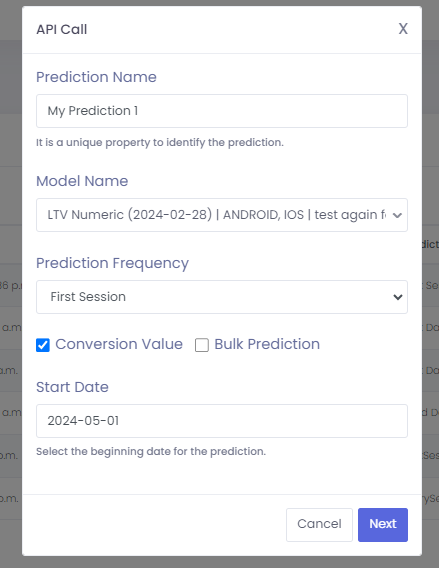
Choosing Direct Response to Game/App prompts you to fill the following fields:
1
Prediction Name: Required. A unique name for your prediction.
2
Model Name: Required. A selectable list of models that you have trained.
3
Prediction Frequency: Optional. The time constraint for the prediction that you will perform, i.e., First Session, etc.
5
Bulk Prediction: A checkbox to specify if the prediction should be done for all the daily users.
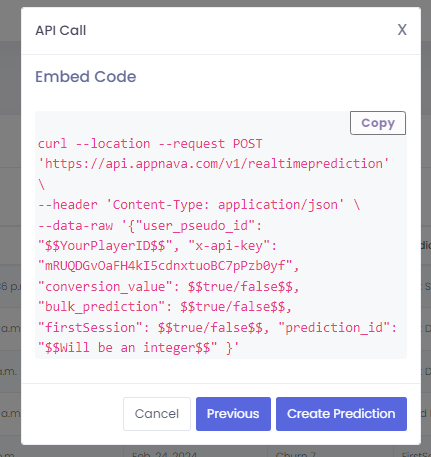
After clicking Next, you will see the following modal that will contain a sample curl request that can be adjusted accordingly.
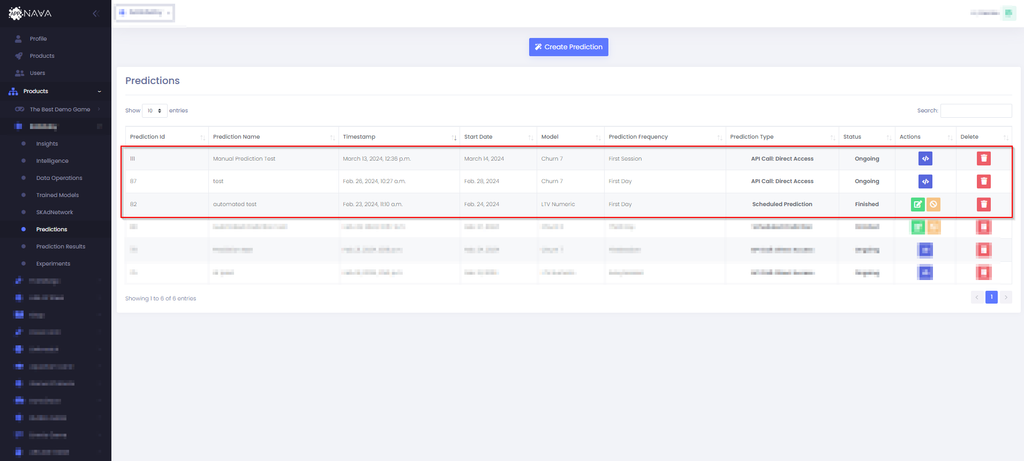
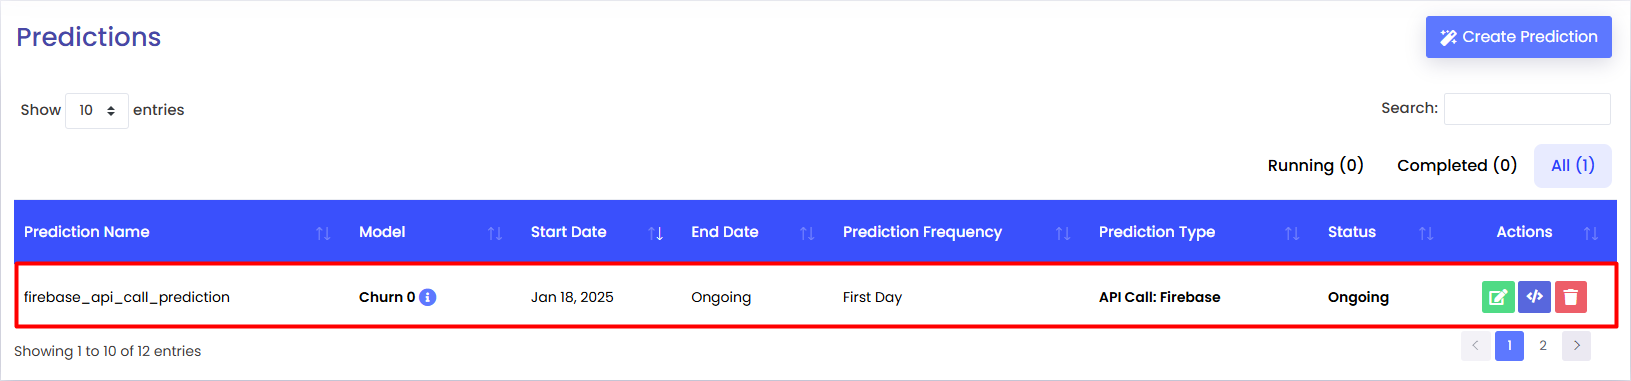
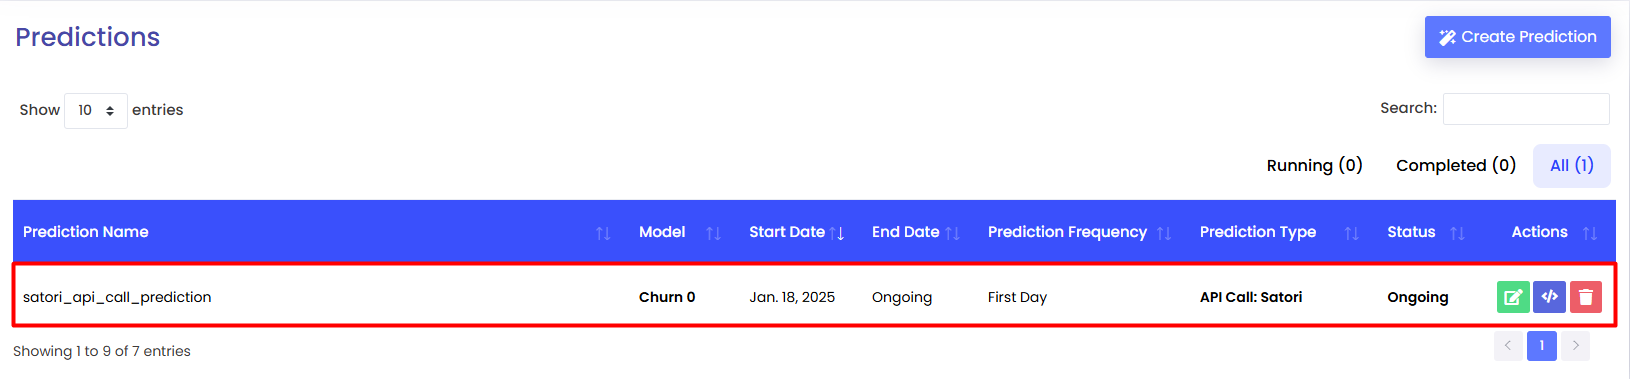
Finally, clicking the Create Prediction button will redirect you back to the Predictions page and create an entry in the table with the Prediction Type as API Call: Direct Access.
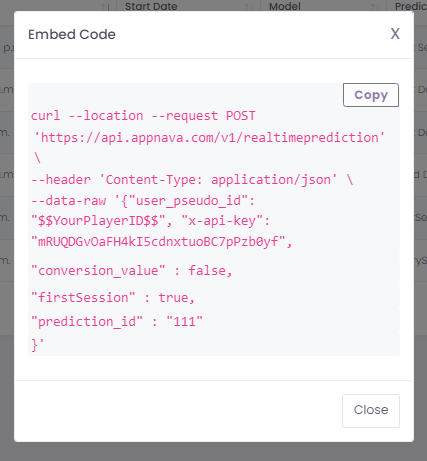
For API Calls, the action tab will have a button to display the generated embed code as follows:
This curl request can be used to hit our endpoint and retrieve the results directly inside the game client or from other sources.
Below are examples of both successful and error responses that your application may receive from the API after making a prediction request. Understanding these formats will help you handle responses programmatically and troubleshoot issues effectively.
All predictions are automatically saved to BigQuery for historical tracking.
The API supports both classification and regression models.
A positive class probability denotes the probability of the class the model is interested in happening i.e in the case of a churn model, it
would simply be Churn and negative class would be vice versa
prediction_probability_for_tertiary_class will be additionally sent but only for the LTV C model since it is a multi-classification
model.
prediction_result will change depending on the model i.e churn model will give a result of either churn or not-churn, a subscriber
model will give a result of subscriber or non-subscriber.
Probability groups for classification models are categorized as follows:
Low: ≤ 0.39
Mid: 0.40 - 0.60
High: > 0.60
As mentioned in before, probability_group will be either “high“, 'mid“ or “low“ and depends on the positive class. This is automatically
classed for general evaulation according to preset conditions and is an estimation. In regressor models, prediction_result is
calculated by checking the average ltv and serves a similar purpose.
Individual users are limited to 20 predictions
API Response (Error Responses)
The API returns different error response formats depending on the error type.
No Data Available
{
  "success": false,
  "error_code": "NO_DATA",
  "message": "No data available for user: user123",
  "user_id": "user123"
}
Too Many Predictions
{
  "success": false,
  "error_code": "SEEN_TOO_MANY",
  "message": "User has exceeded maximum prediction limit",
  "user_id": "user123"
}
No Users Found
{
  "success": false,
  "error_code": "NO_USERS_FOUND",
  "message": "No users found matching the criteria",
  "user_id": "N.A (Bulk Pred)"
}
Common Mistakes:
Often the curl requests are not constructed properly inside the game client and hence the requests fails.
The --data-raw option specifies the data to be sent to the endpoint as a JSON object, it should be ensured that the JSON is properly
formatted and is valid.
Booleans should be lowercase in JSON e.g true is valid but True is not valid.
JSON should be sent in the body of a HTTP request and should not be nested inside another body key.
Tip
In addition to using the Direct Response to Game/App method, you can also integrate predictions via third-party platforms. Currently, two integration options are supported: Satori and Firebase. These options require specific API credentials and setup steps to enable communication between the game and the prediction engine.
You can select the “Through Firebase” option.
If you have not set both the Android/iOS App ID and Secret ID,
you will not be allowed to select the “Through Firebase” option. Instead, you'll see the following warning modal:
To enable this option, please
update your product and provide the required keys.
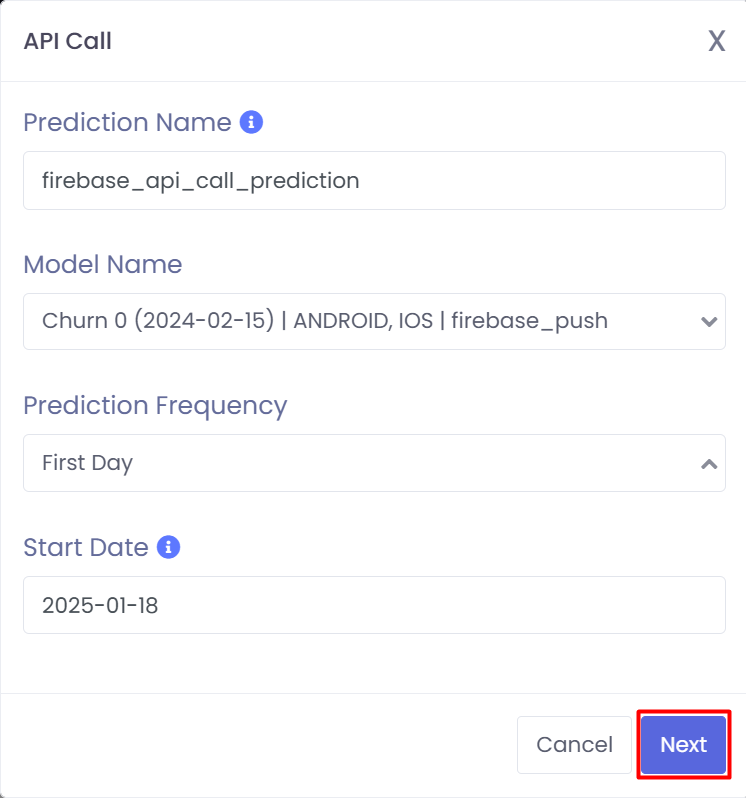
Assuming the option is enabled, you will be directed to the following modal. You can then fill out the following
standard fields and choose the respective model and prediction frequency.
1
Prediction Name: Required. A unique name for your prediction.
2
Model Name: Required. A selectable list of models that you have trained.
3
Prediction Frequency: Optional. The time constraint for the prediction that you will perform, i.e., First Session, etc.
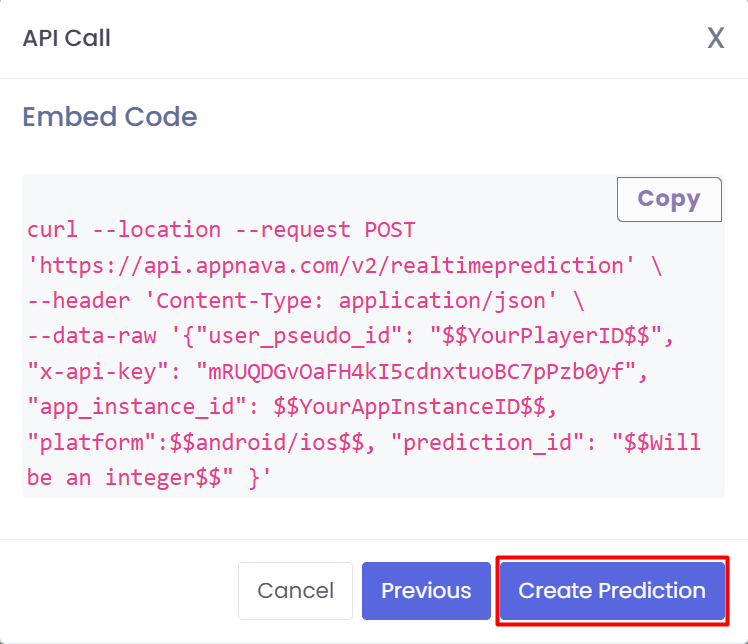
You will then be prompted to finalize the prediction and shown a sample curl request that can be used to call the
prediction api.
After a successful creation, you will be able to see your prediction api call as a row on the Predictions Page.
And that’s it! Your API is now primed to generate predictions and seamlessly send them to Firebase, unlocking powerful realtime processing and insights to drive your application to the next level!
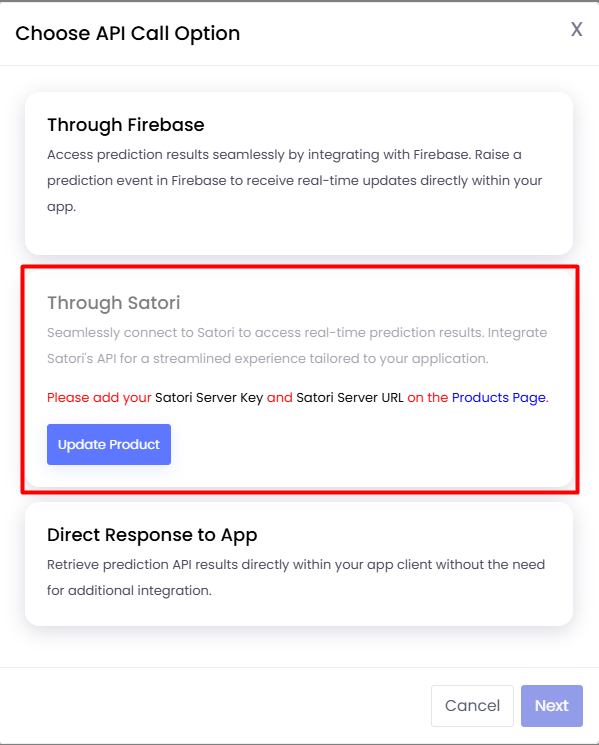
You can select the “Through Satori” option.
If you have not set the Satori Server Key or the Satori Server URL then you will not be allowed to choose the
“Through Satori” option and will be shown the following modal.
To enable this option, please
update your product and provide the required keys.
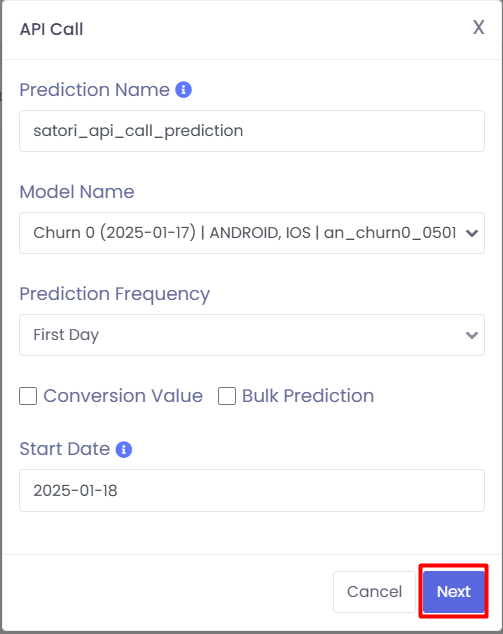
Assuming the option is enabled, you will be directed to the following modal. You can then fill out the following
standard fields and choose the respective model and prediction frequency.
1
Prediction Name: Required. A unique name for your prediction.
2
Model Name: Required. A selectable list of models that you have trained.
3
Prediction Frequency: Optional. The time constraint for the prediction that you will perform, i.e., First Session, etc.
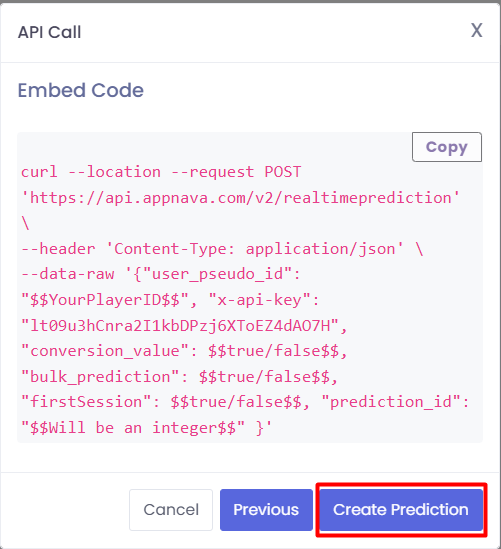
You will then be prompted to finalize the prediction and shown a sample curl request that can be used to call the
prediction api. It should be noted that the user_pseudo_id field here pertains to the nakama_id
field of a user
After a successful creation, you will be able to see your prediction api call as a row on the Predictions Page.
And that’s it! Your API is now primed to generate predictions and seamlessly send them to Satori, unlocking powerful realtime processing and insights to drive your application to the next level!
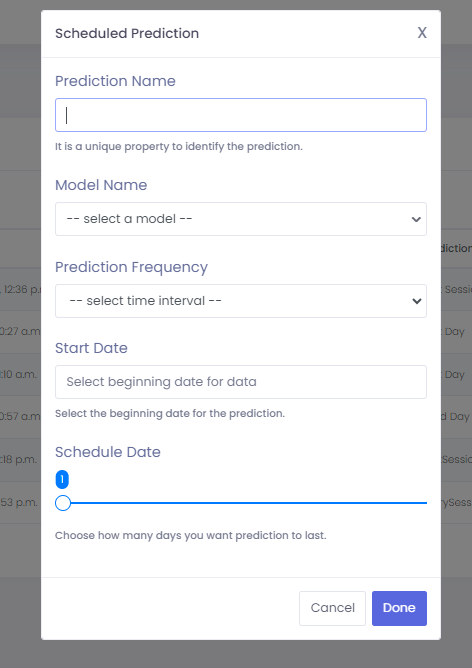
This option allows you to schedule predictions for a specific duration that will run daily automatically. Upon clicking the option, a modal can
be seen with the following fields:
1
Prediction Name: Required. A unique name for your prediction.
2
Model Name: Required. A selectable list of models that you have trained.
3
Prediction Frequency: Optional. The time constraint for the prediction that you will perform, i.e., First Session, etc.
3
Start Date: Required. When the scheduled prediction should start.
3
Schedule Date: Required. The duration for the scheduled prediction in days i.e how long it should last?
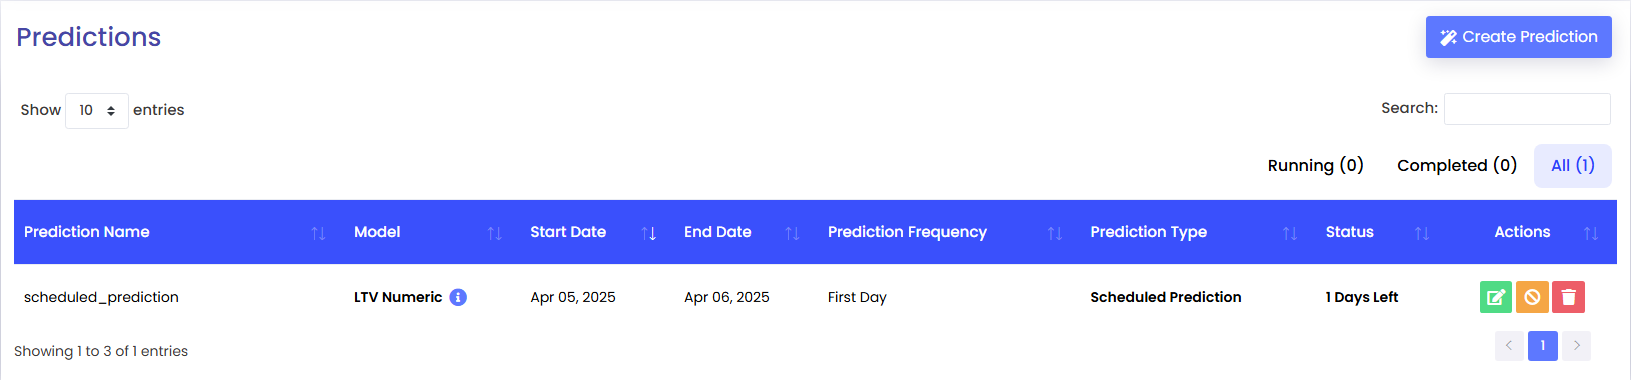
Lastly, after clicking done, you will be redirected to the Predictions page and prediction will be created in the table with the status
Scheduled Prediction.
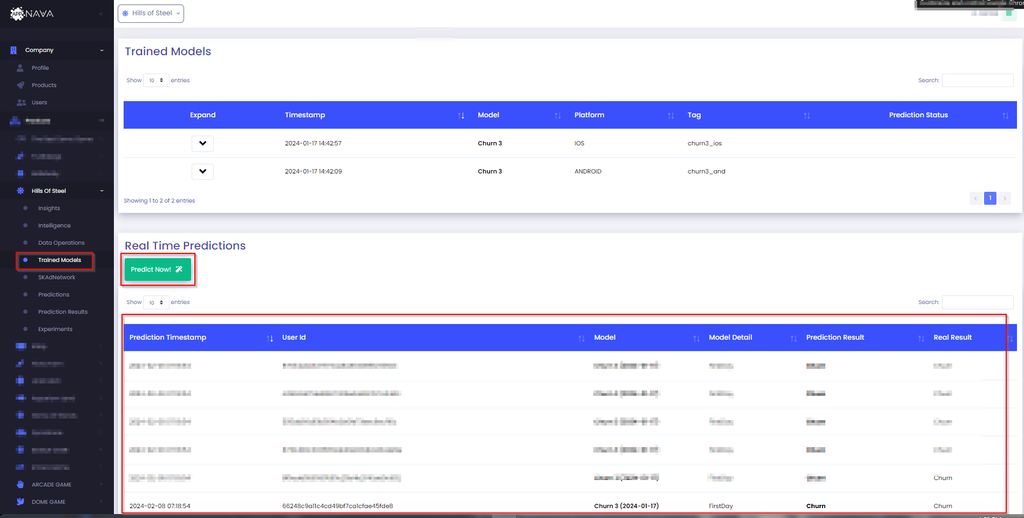
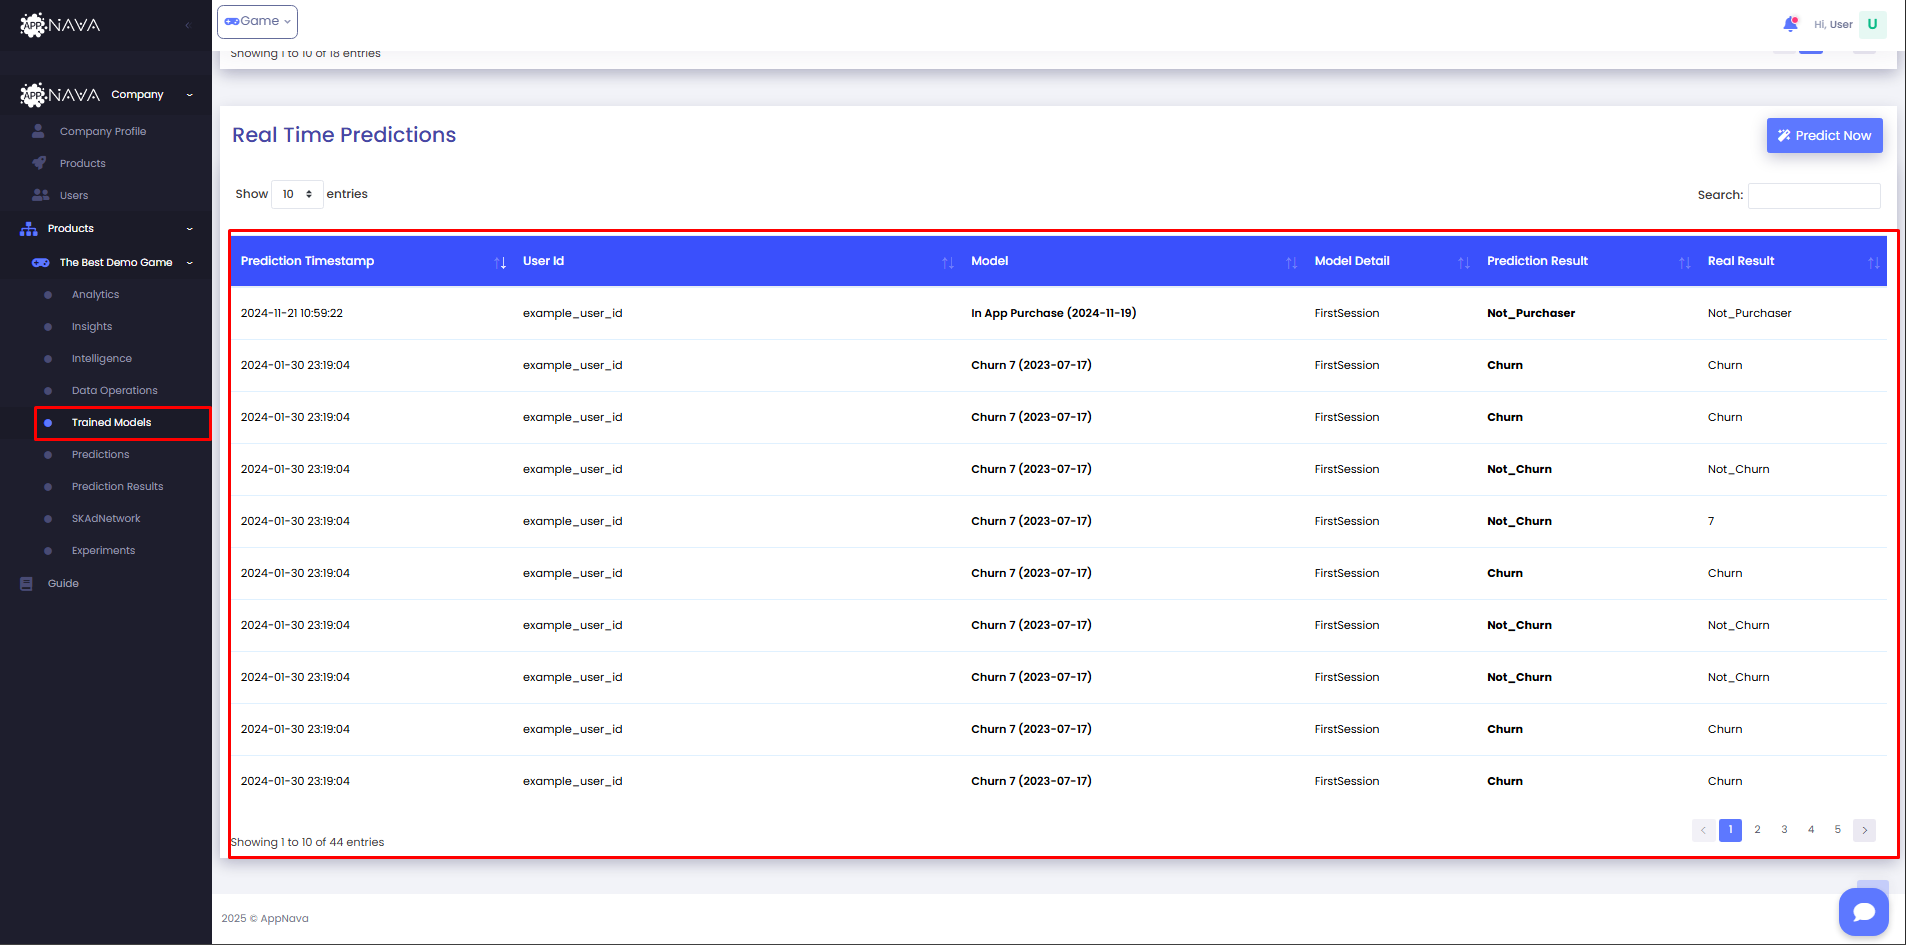
Predictions can be done directly through the dashboard by clicking on the Predict Now in Trained Models tab.
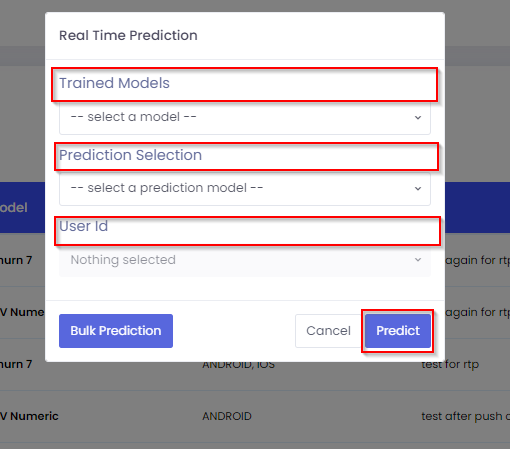
After clicking the Predict Now button, you will see a modal (a slight delay might occur while fetching daily users) to select the following options:
After selecting these fields, the Predict button can be clicked to start the prediction and upon successful completion the results should be available in the table below.
1
Trained Models: Required. A list of selectable models that you have trained.
2
Prediction Selection: Required. The duration for the prediction that you will perform. A choice between First Session and First Day.
3
User Id: Optional. A list of users that are multi-selectable and on which the predictions will be performed.
Note
The Bulk Prediction button is an experimental feature and is subject to change. Clicking this button performs predictions for all users of the day and stores the results in our database (results are not visible on the dashboard). The fields Trained Models and Prediction Selection are mandatory, while the User Id field is optional for this feature.
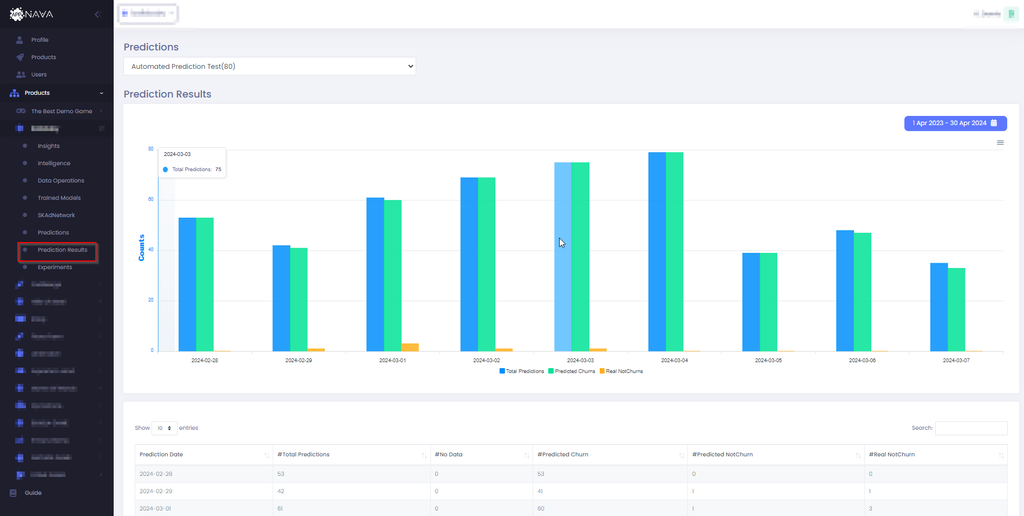
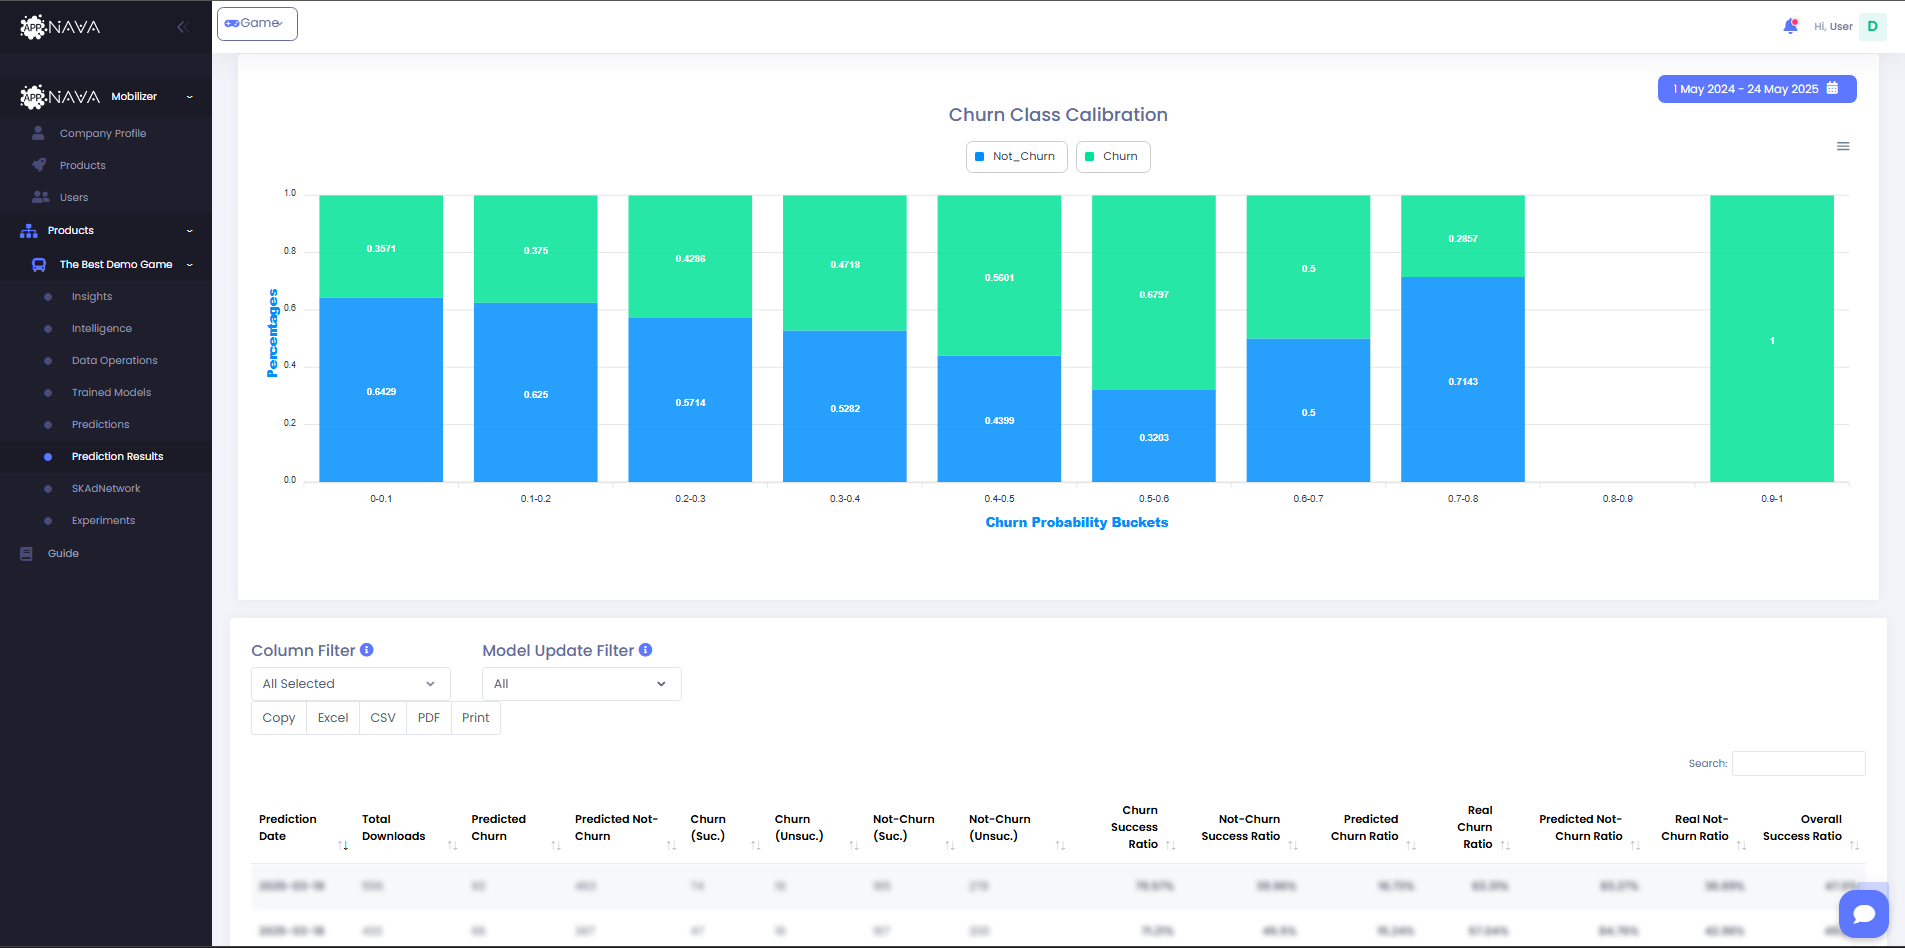
Appnava offers an elegant solution for visualizing your data. API call and Scheduled prediction requests can be visualized using the Prediction Results tab.
The table and chart shows an accumulation of daily predictions. Depending on the models i.e Churn, LTV etc the columns will vary. The real
results are calculated depending on the model as well and can be compared to the predicted results to evalute the accuracy of the model.
For Instant Predictions
You can access these results by navigating to the Trained Models tab. If any real-world results become available, they will also appear in the
Real Result column to assess accuracy.
These results are presented in a structured table and include key information such as:
Prediction Timestamp: When the prediction request was made.
User ID: The unique identifier of the user the prediction was made for (pseudonymized).
Model: The name of the model used for prediction along with the training timestamp.
Model Detail: A brief summary of the model type or characteristics.
Prediction Result: The predicted value or label returned by the model.
Real Result: If available, the actual outcome observed after the prediction, used for model evaluation.
E. Integration
In this section you can learn about how to configure database connection. Below steps describe how AppNava works for Firebase / Google Cloud & Unity customers.
Below steps describe how AppNava works for Firebase / Google Cloud & Unity customers.
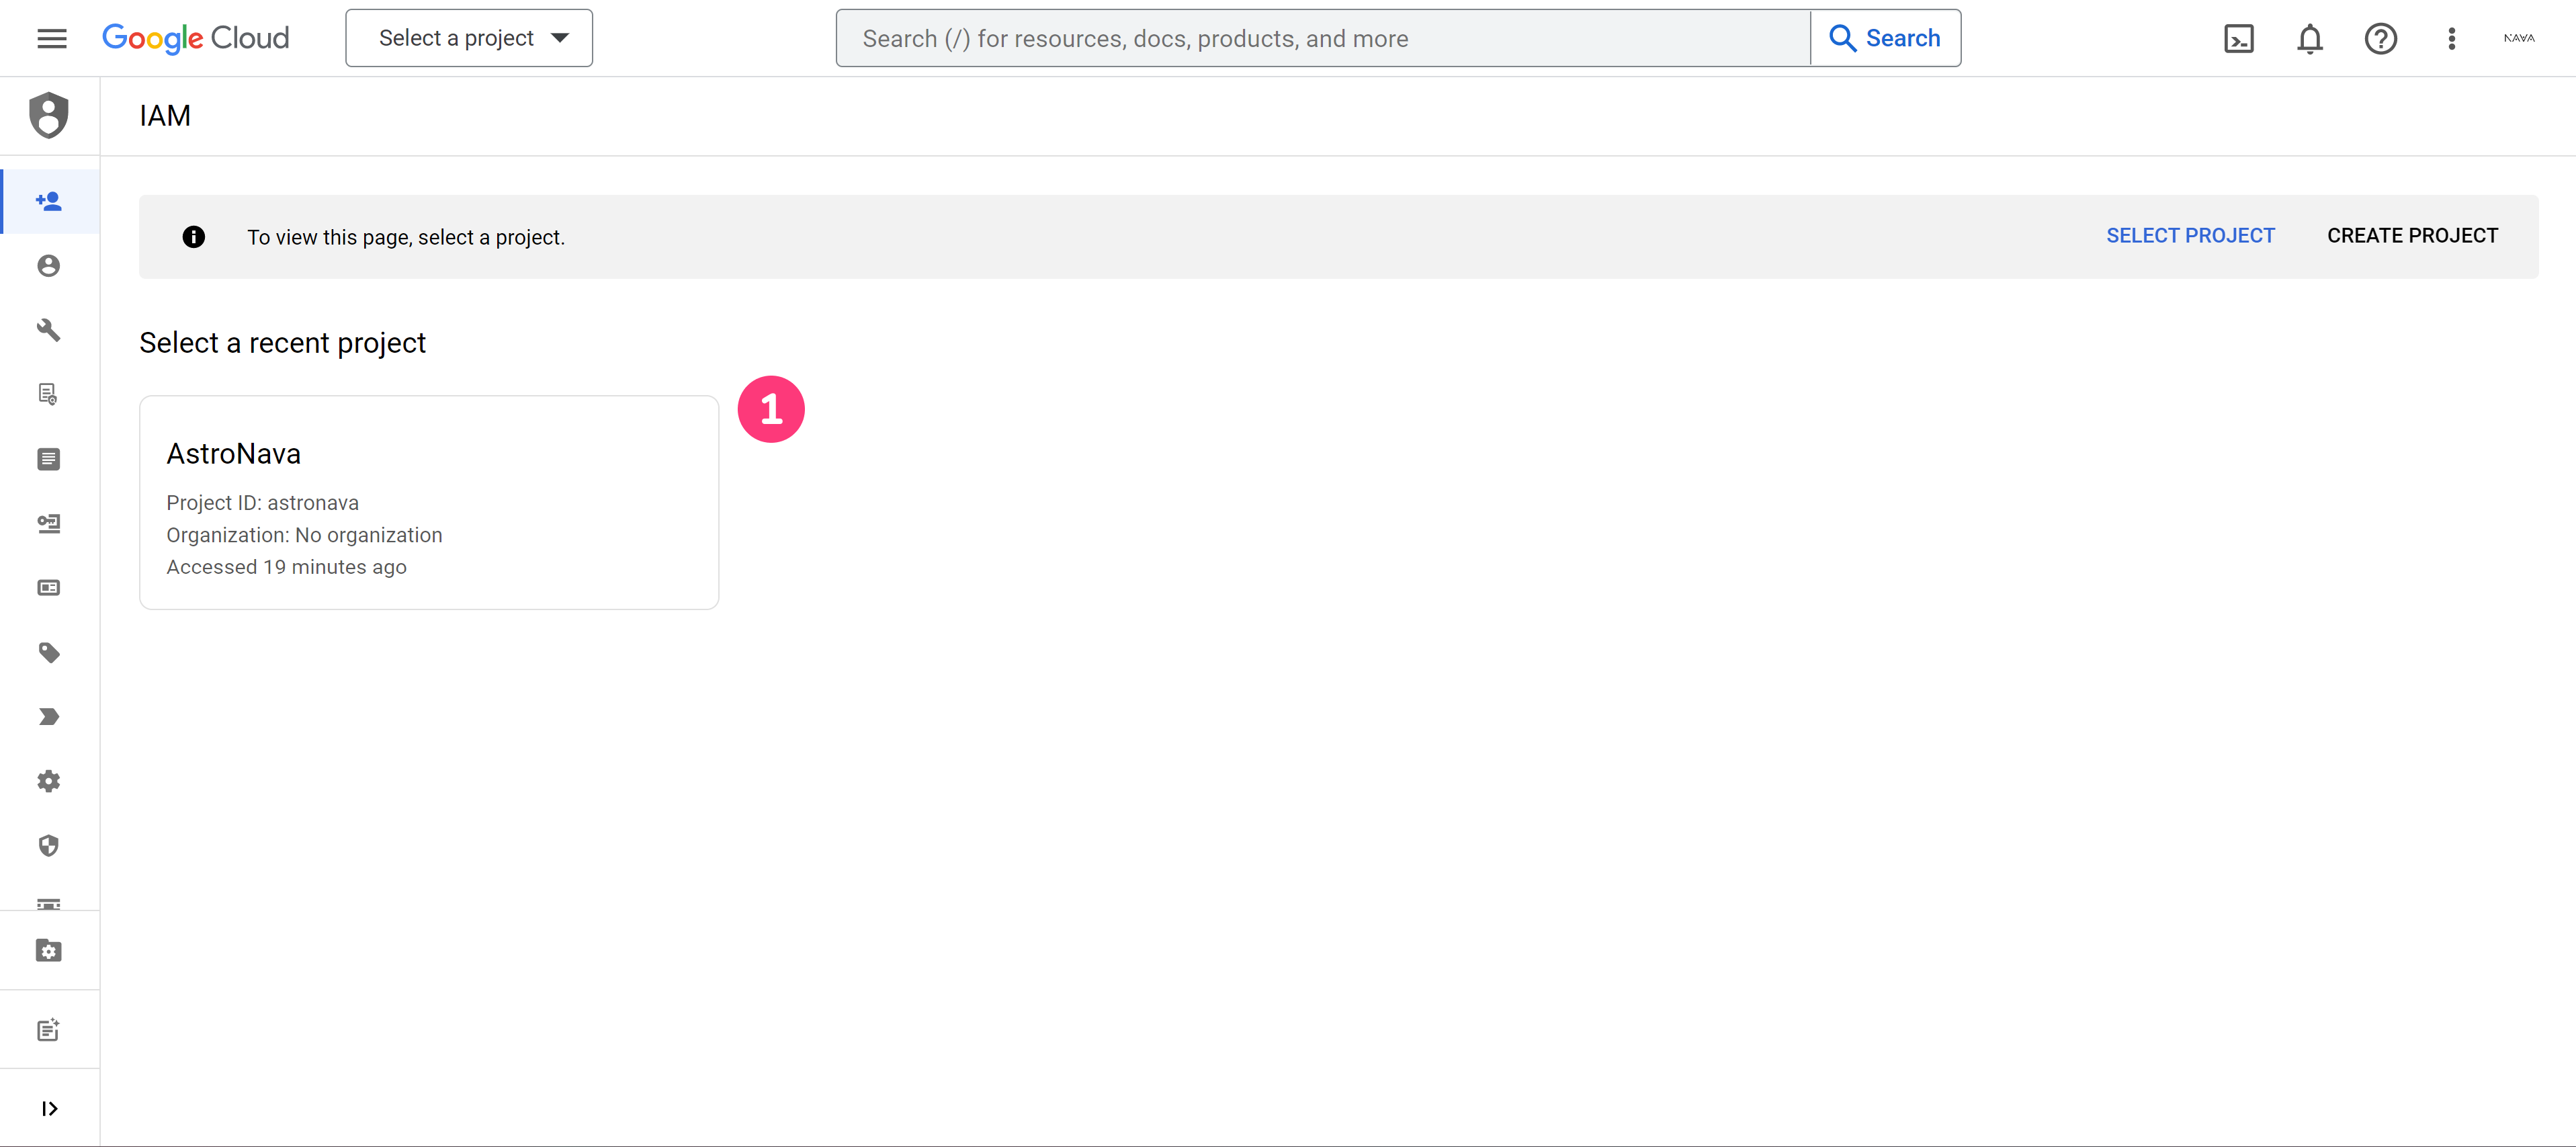
Create a new Google Cloud Console project or select an existing project.
Navigate to the APIs table: Open the Navigation menu in the top-left corner, click APIs & Services, then click Library.
Activate BigQuery: Under Google Cloud APIs, click BigQuery API. On the following page, click Enable.
If prompted, review and agree to the Terms of Service.
Step 2: Prepare your project for BigQuery Export
You can export Google Analytics data to the BigQuery sandbox free of charge (sandbox limits apply).
Learn more about upgrading from the sandbox and BigQuery pricing.
Step 3: Link a Google Analytics 4 property to BigQuery
After you complete the first two steps, you can enable BigQuery Export from Analytics Admin.
BigQuery Export is subject to the same collection and configuration limits as Google Analytics. If you need higher limits, you can upgrade your property to 360.
In Admin, under Product Links, click BigQuery Links. Note: The previous link opens to the last Analytics property you accessed. You can change the property using the property selector.
You must be an Editor or above at the property level to link an Analytics property to BigQuery.
You must also use an email address that has OWNER access to the BigQuery project (view Permissions below for detailed access requirements).
Click Link.
Click Choose a BigQuery project to display a list of projects for which you have access.
If you have linked Analytics and Firebase (or plan to), consider exporting to the same Cloud project, which will facilitate easier joins with other Firebase data.
Select a project from the list, then click Confirm.
Select a location for the data. (If your project already has a dataset for the Analytics property, you can't configure this option.)
Click Next.
Select Configure data streams and events to select which data streams to include with the export and specific events to exclude from the export. You can exclude events by either clicking Add to select from a list of existing events or by clicking Specify event by name to choose existing events by name or to specify event names that have yet to be collected on the property.
Click Done.
Select Include advertising identifiers for mobile app streams if you want to include advertising identifiers. Note: To ensure smooth functionality and avoid issues, make sure to enable Include Advertising Identifiers in Export in Firebase settings under Project > Settings > Integrations > BigQuery.
Select either or both a Daily (once a day) or Streaming (continuous) export of data. For Analytics 360 properties, you may also select Fresh Daily.
Click Next.
Review your settings, then click Submit.
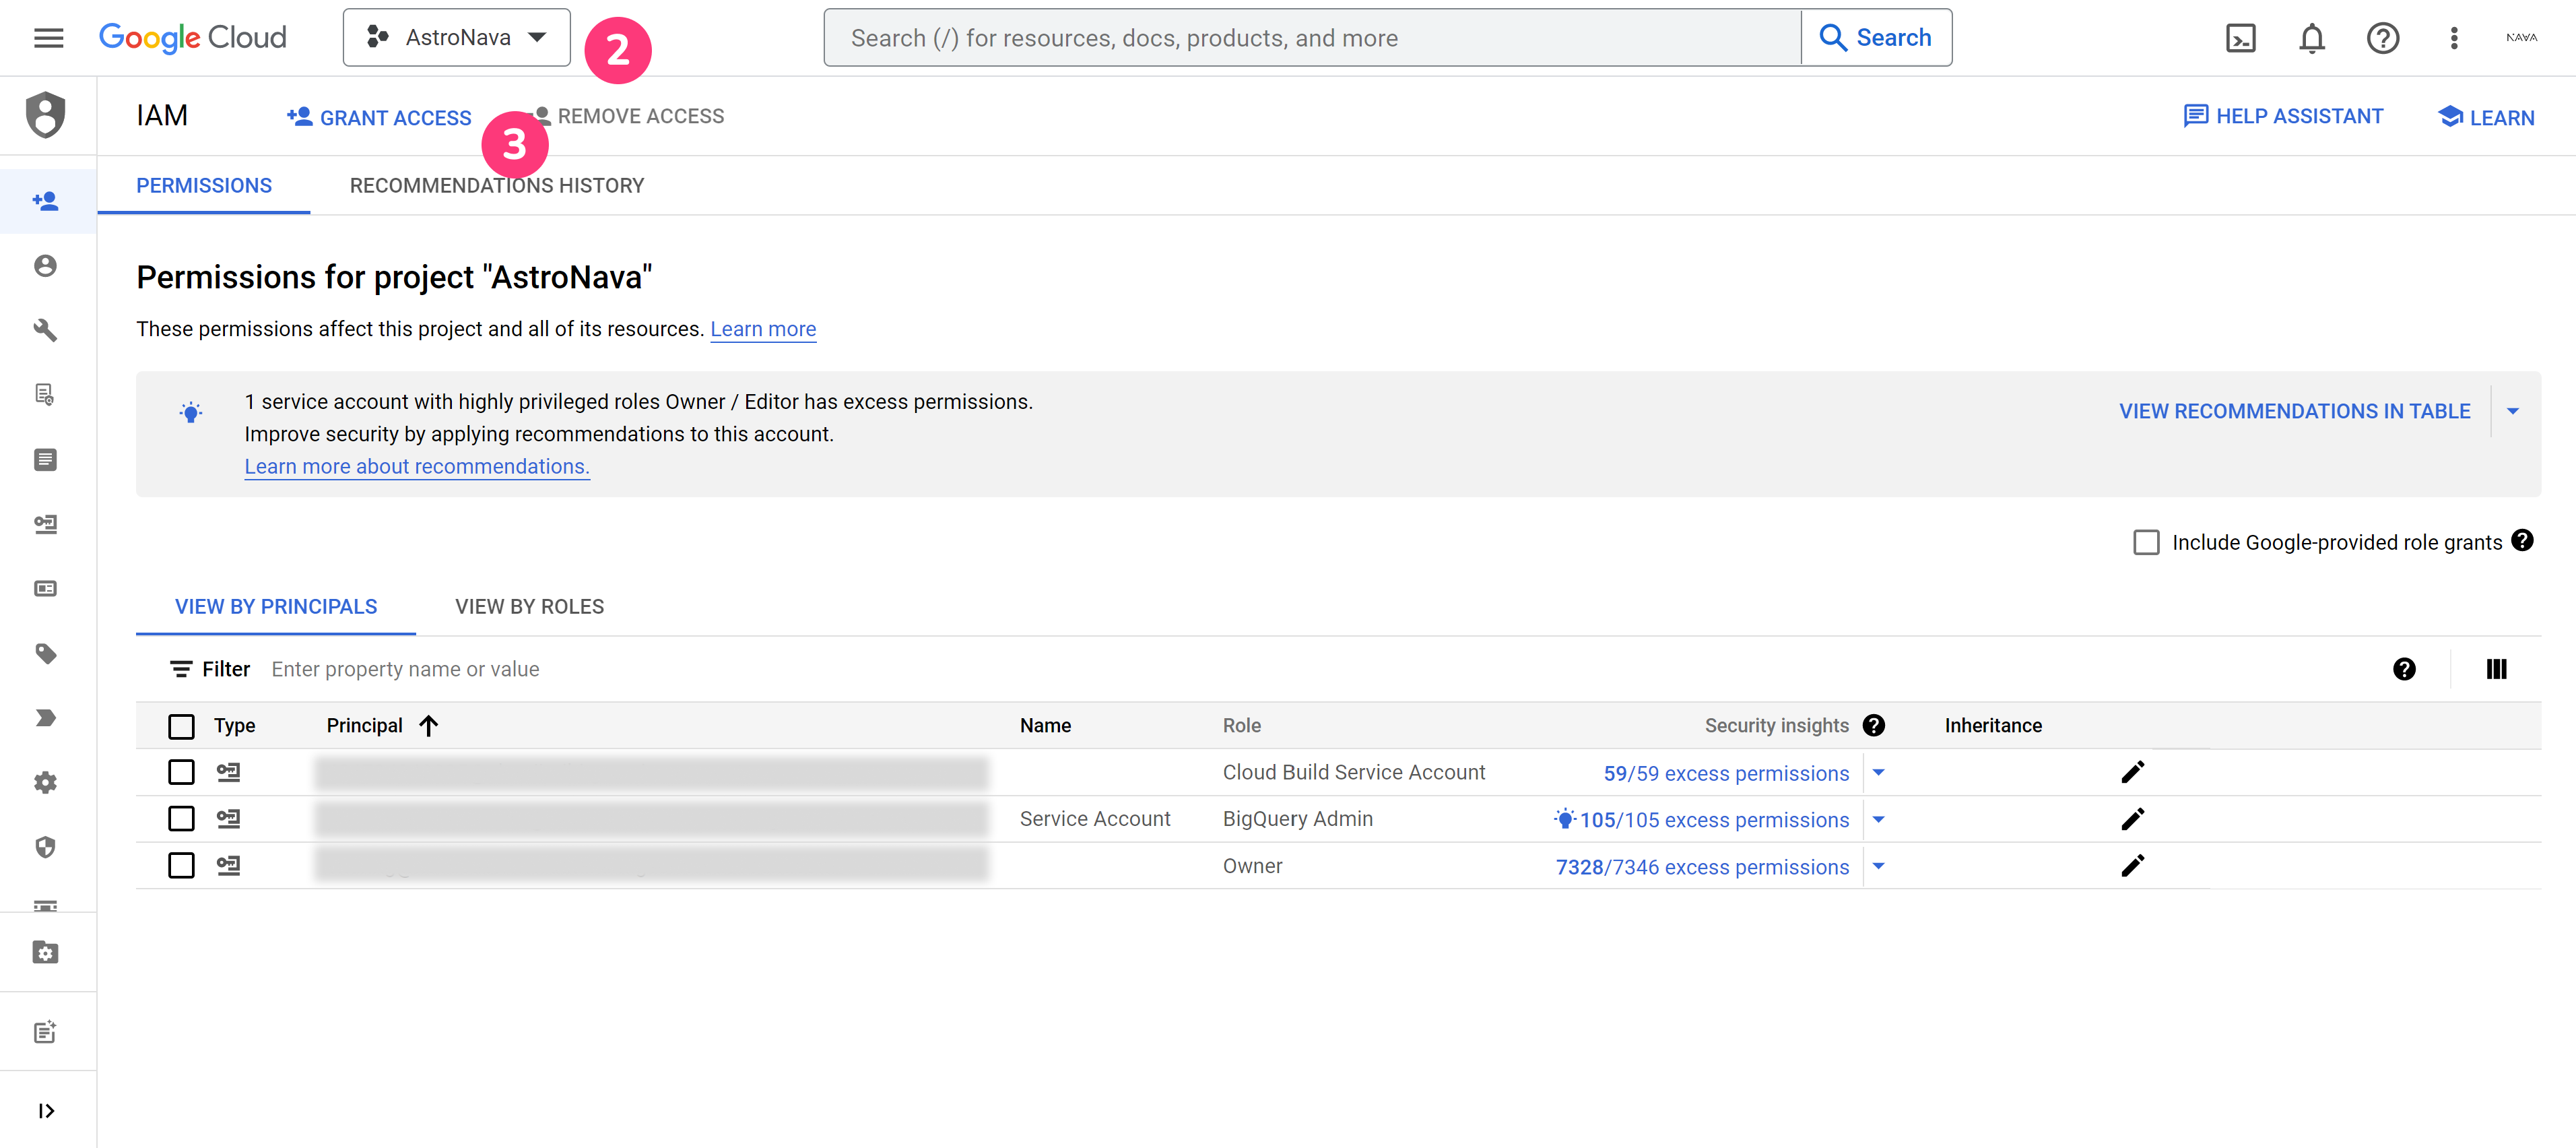
Permissions
Project getIamPolicy/setIamPolicy rights, Services get/enable rights. OWNER is a superset of these permissions.
To create a BigQuery link the minimal permissions you need are:
resourcemanager.projects.get: To get the project
resourcemanager.projects.getIamPolicy: To get a list of permissions
resourcemanager.projects.setIamPolicy: To check if user has permission to create the link on this project
serviceusage.services.enable: To enable the BigQuery API
serviceusage.services.get: To check if the BigQuery API is enabled
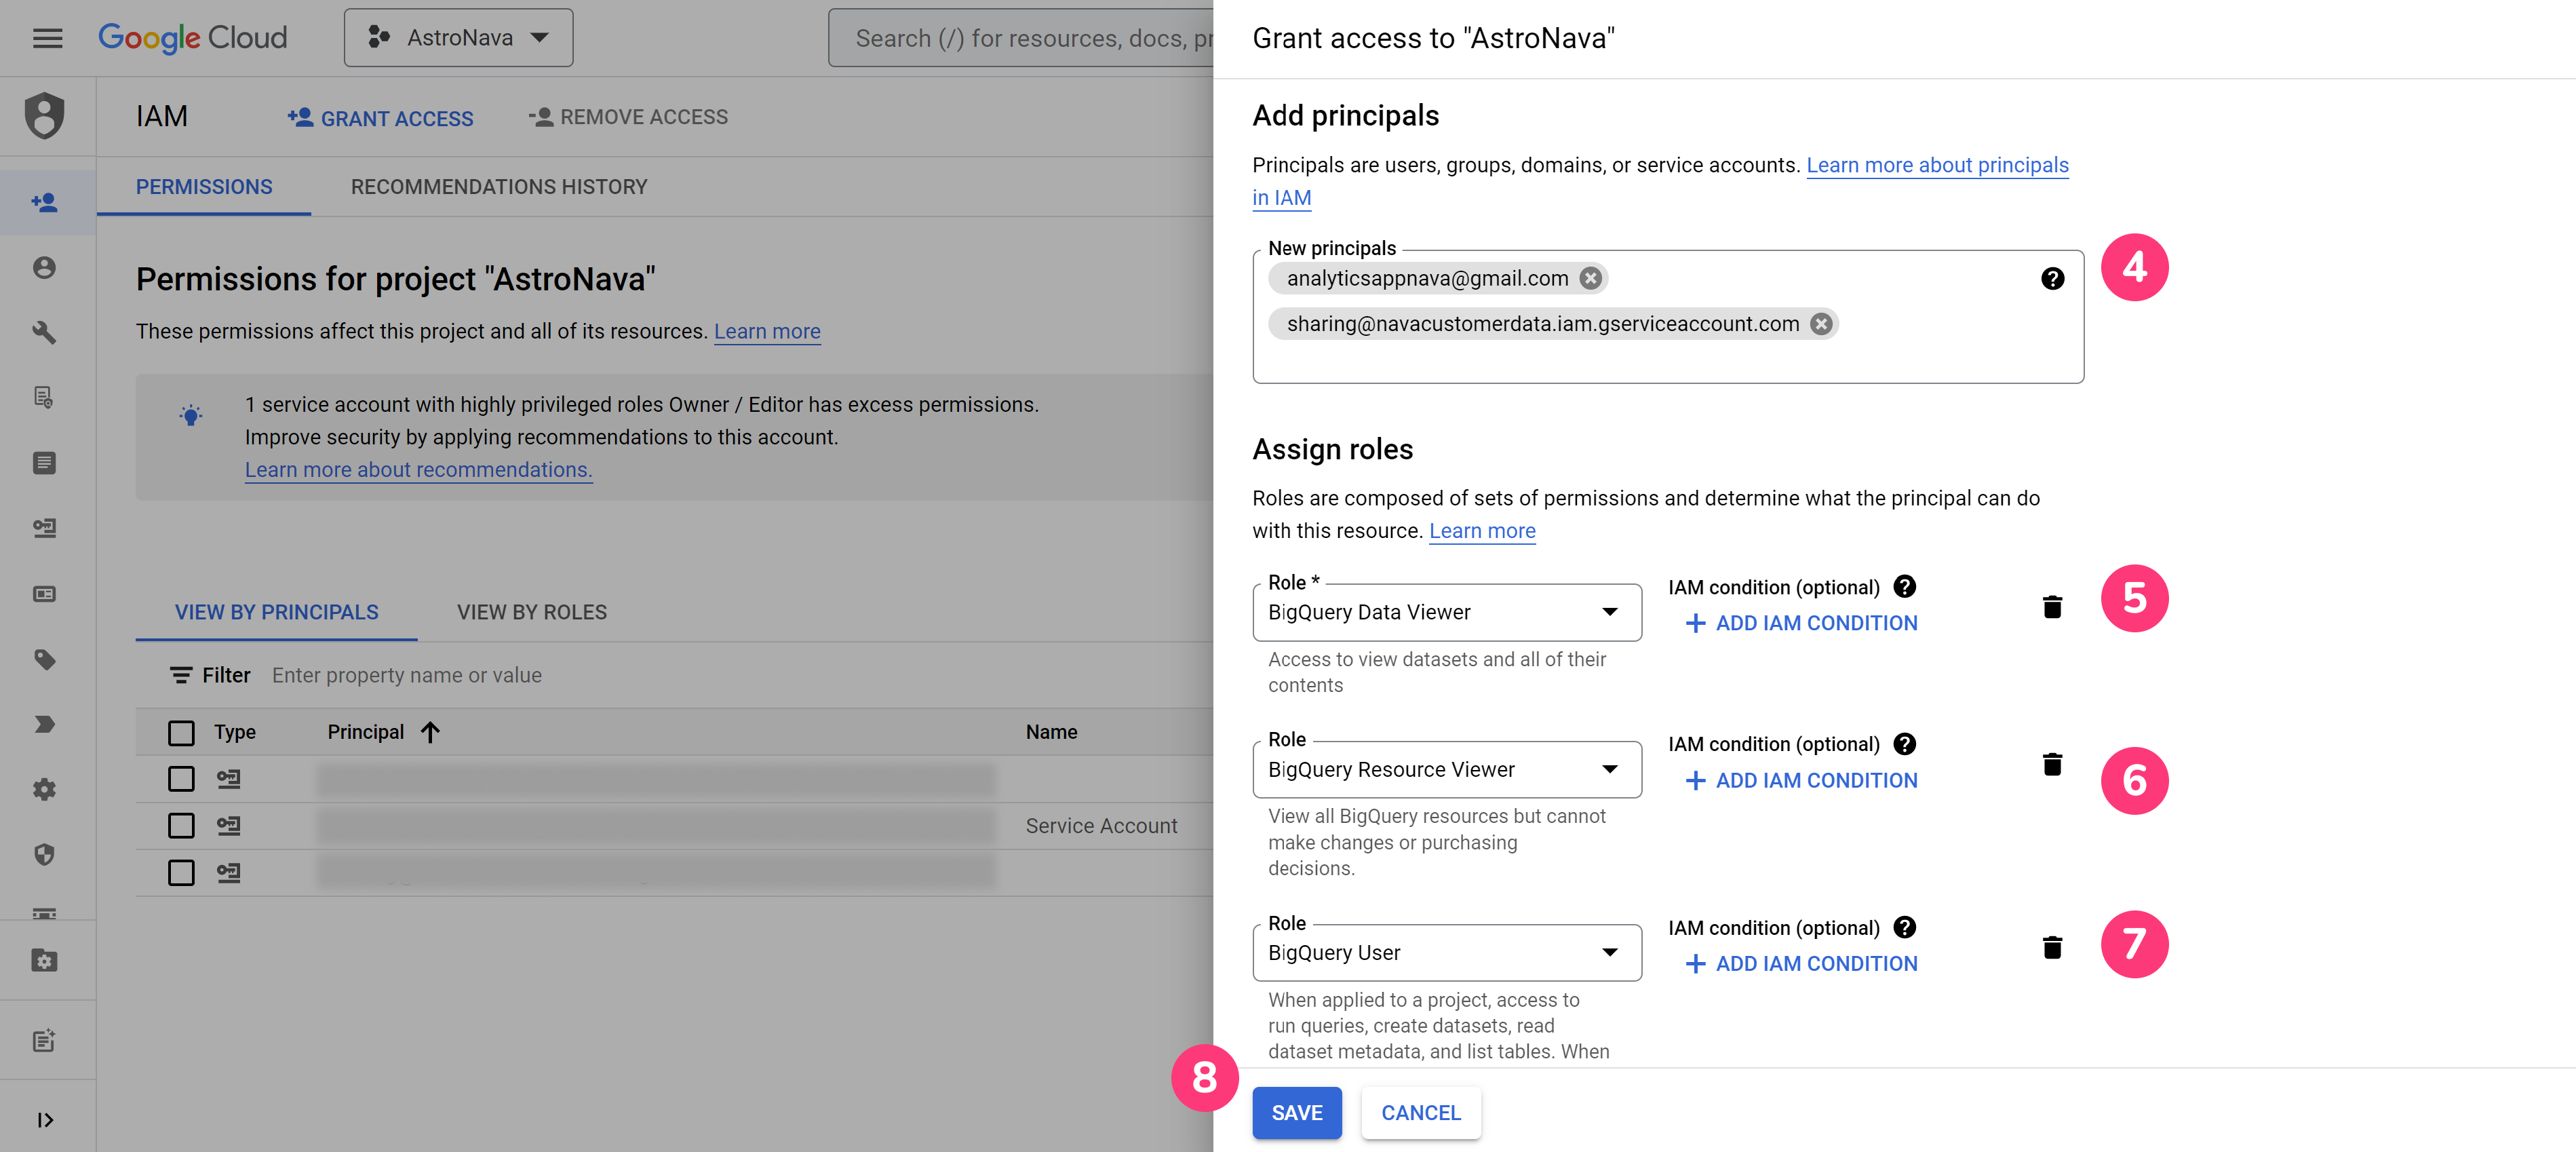
Verify the service account
When you link Analytics and BigQuery, that process creates the following service account:
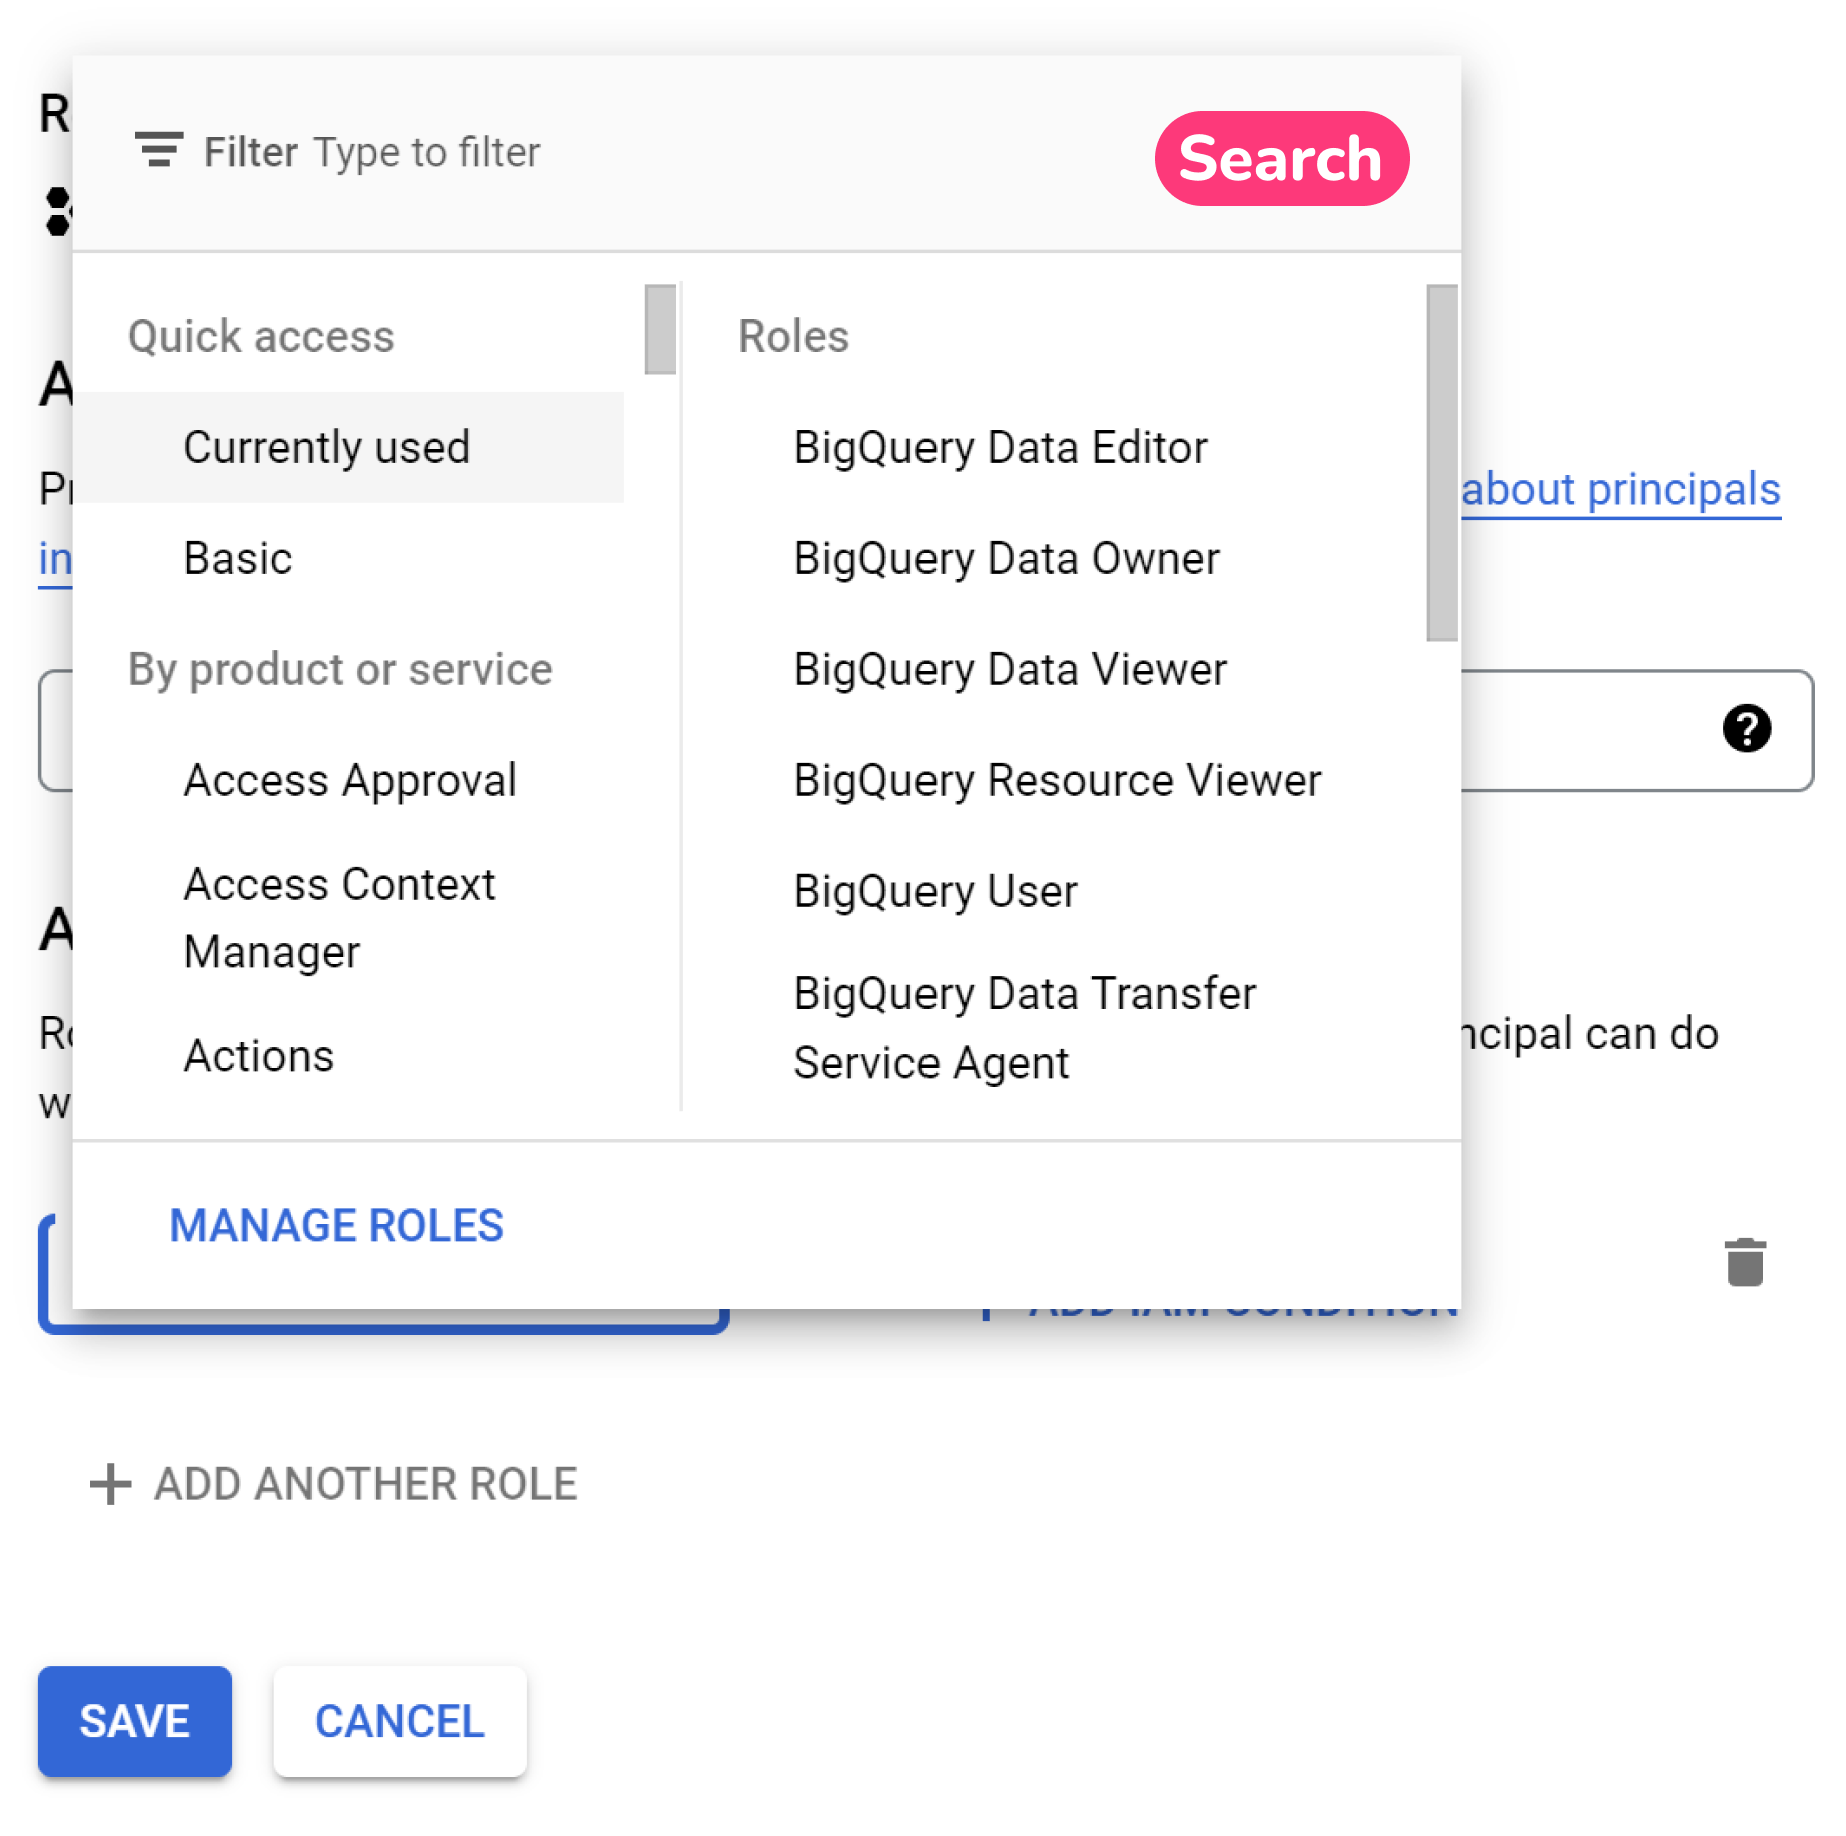
Verify that the account has been added as a member of the project, and given the role of BigQuery User (roles/bigquery.user).
If you previously set up BigQuery Export to give your service account the Editor role for the Google Cloud project, you can reduce that role to BigQuery User. To change the role for the service account, you need to unlink and then relink Analytics to your BigQuery project. The first step is to unlink Analytics and BigQuery and remove the service account with the Editor role. Then, relink Analytics and BigQuery per the instructions above to create the new service account with the correct permission for the project.
After relinking, ensure that the Service Account has the Owner (bigquery.dataOwner) role on the existing export dataset. You can do this by viewing access policy of the dataset.
Change regions
If you choose the wrong region and need to change it after you've created the link:
Delete the link to BigQuery (see below).
Backup the data to another dataset in BigQuery (move or copy).
Delete the original dataset. Take note of the name: you'll need it in the next step.
Create a new dataset with the same name as the dataset you just deleted, and select the location for the data.
Share the new dataset with [email protected] and give the service account the BigQuery Data Owner role.
Copy the backup data into the new dataset.
Repeat the procedure above to create a new link to BigQuery.
After changing the location, you'll have a gap in your data: streaming and daily exports of data will not process between deletion of the existing link and creation of the new link.
Delete a link to BigQuery
In Admin, under Product Links, click BigQuery Links. Note: The previous link opens to the last Analytics property you accessed. You can change the property using the property selector. You must be an Editor or above at the property level to delete a link to BigQuery.
Click the row for the link.
In the top right, click More > Delete.
BigQuery Export limits
Standard GA4 properties have a BigQuery Export limit of 1 million events for Daily (batch) exports. There is no limit on the number of events for Streaming export. If your property consistently exceeds the export limit, the daily BigQuery export will be paused and previous days’ exports will not be reprocessed.
For Analytics 360 properties, the Fresh Daily export contains all data fields and columns understood to be in the daily export, including observed user attribution and Ad Impression data. Learn more about the Fresh Daily export.
Property editors and administrators will receive an email notification each time a property they manage exceeds the daily limit. That notification will indicate when their export will be paused if action is not taken. Additionally, if a standard property significantly exceeds the one-million-event daily limit, Analytics may pause daily exports immediately. If you receive a notification, please leverage the data-filtering options (data-stream export and event-exclusion) to decrease the volume of events exported each day and ensure the daily export continues to operate.
Learn more about the higher limits available with 360 properties.
Data filtering
You can exclude specific data streams and events from your export, either to limit the size of your export or to make sure you're exporting just the events you want in BigQuery.
Exclude data streams and events during linking process: During the linking process, when you select the data streams you want to export, you also have the option to select events to exclude from export. See Step 9 in the linking process.
Add or remove data streams or events after you've configured linking: You can add or remove data streams and add events to or remove events from the exclusion list after you've configured the BigQuery link.
In Admin, under Product Links, click BigQuery Links. Note: The previous link opens to the last Analytics property you accessed. You can change the property using the property selector.
You must be an Editor or above at the property level to add or remove data streams or events.
You must also use an email address that has OWNER access to the BigQuery project.
Click the row for the project whose link you want to modify.
Under Data streams and events, click View data streams and events.
Under Data streams to export, you can select additional data streams to export or remove existing data streams from the list.
On the Events to exclude list, click Add to select from a list of existing events or click Specify event by name to choose existing events by name or to specify event names that have yet to be collected on the property.
To remove an event from the list, click the minus sign at the end of that row.
Pricing and billing
BigQuery charges for usage with two pricing components: storage and query processing. You can review the pricing table and learn about the differences between interactive and batch queries.
You need to have a valid form of payment on file in Cloud in order for the export to proceed. If the export is interrupted due to an invalid payment method, we are not able to re-export data for that time.
You can also export Analytics data to the BigQuery sandbox free of charge but keep in mind that sandbox limits apply.
When you start seeing data
Once the linkage is complete, data should start flowing to your BigQuery project within 24 hours. If you enable daily export, then 1 file will be exported each day that contains the previous day’s data (generally, during early afternoon in the time zone you set for reporting).
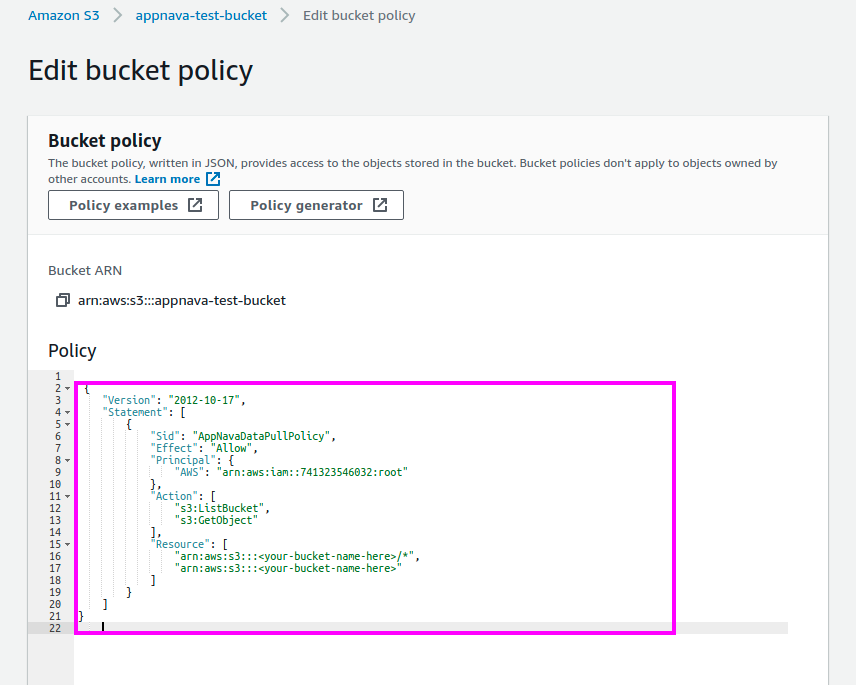
Below steps describe how AppNava works for AWS customers
Collect Data
Use an AWS service of your choice to collect data into a bucket
Share the UNITY_UNITYLIVEOPS_UNITY_ANALYTICS_PDA view with our Snowflake account.
Option 2: Custom Analytics Integration
It is recommended that a materialized view/table with the following structure be created. Any deviation may result in delays during the integration process due to required changes:
Data Structure
user_id (String): The unique identifier for the user.
user_data (JSON): Nested information about the user, such as country, gender, age, etc.
device_id (String): The unique identifier for the user’s device.
device_data (JSON): Nested information about the device, including app version, geo-location data, OS version, platform (e.g., "android" or "ios"), device brand, etc.
session_id (Int): A sequential identifier for the session. For example, "1" represents the user's first session.
session_data (JSON): Nested information about the session, such as start time, end time, etc.
event_name (String): The name of the event triggered by the user.
event_data (JSON): Nested information about the game event, including event timestamp, value (string or int), event type, etc.
Note
For time-related fields, it’s recommended to provide both millisecond and timezone timestamps, such as 1710941700000 or 2024-03-20 15:00:00. If both formats are not available, priority should be given to timezone timestamps.
Access Requirements
AppNava requires access to the materialized view/table. The most efficient way to grant this access is via Snowflake Secure Data Sharing.
The materialized view/table must be shared with AppNava’s account (ID: kp95306) to enable querying.
Integration Timeline
The integration process may take approximately 2-3 weeks, depending on the quality and complexity of the client's data. During this period, we will analyze their data and make necessary adjustments to our system to accommodate their specific data structure.
As part of this process, there may be challenges such as errors in the data, discrepancies that
require clarification, or potential anomalies in user data that need further investigation.
Additionally, we might need to engage in back-and-forth communication to clarify any edge
cases or make adjustments based on their data’s nature. This iterative process is essential to
ensure that the integration runs smoothly and that both parties are aligned on expectations.
Initial Setup
A materialized view aggregating data is recommended for efficient real-time querying by AppNava. Alternatively, any table or view that supports real-time user data queries can be used.
Materialized View/Table Structure
It is recommended that the following structure be adhered to. Any deviation may result in delays during the integration process due to required changes:
user_id (String): The unique identifier for the user.
user_data (JSON): Nested information about the user, such as country, gender, age, etc.
device_id (String): The unique identifier for the user’s device.
device_data (JSON): Nested information about the device, including app version, geo-location data, OS version, platform (e.g., "android" or "ios"), device brand, etc.
session_id (Int): A sequential identifier for the session. For example, "1" represents the user's first session.
session_data (JSON): Nested information about the session, such as start time, end time, etc.
event_name (String): The name of the event triggered by the user.
event_data (JSON): Nested information about the game event, including event timestamp, value (string or int), event type, etc.
Note
For time-related fields, it’s recommended to provide both millisecond and timezone timestamps, such as 1710941700000 or 2024-03-20 15:00:00. If both formats are not available, priority should be given to timezone timestamps.
Access Requirements
AppNava requires access to the materialized view/table. The most efficient way to grant this access is via Amazon Redshift Data Sharing.
The materialized view/table must be shared with AppNava’s account (ID: 324464245602) to enable querying.
Granting Data Share Access
To grant access to the materialized view/table, the following example query can be adjusted and run:
-- Create a data shareCREATE DATASHAREtest_datashare;
-- Add the relevant schema and materialized view/table to the data shareALTER DATASHAREtest_datashareADD SCHEMAtickit;
ALTER DATASHAREtest_datashareADD TABLEtickit.sales_mv;
-- Grant access to AppNava's accountGRANT USAGE ON DATASHAREtest_datashareTO ACCOUNT'324464245602';
Ensuring Public Access
To avoid VPC access issues, the datashare must be made publicly accessible:
-- The name of the actual datashare must be provided hereALTER DATASHAREtemp_datashareSET PUBLICACCESSIBLE= TRUE;
Integration Timeline
The integration process may take approximately 2-3 weeks, depending on the quality and complexity of the client's data. During this period, we will analyze their data and make necessary adjustments to our system to accommodate their specific data structure.
As part of this process, there may be challenges such as errors in the data, discrepancies that
require clarification, or potential anomalies in user data that need further investigation.
Additionally, we might need to engage in back-and-forth communication to clarify any edge
cases or make adjustments based on their data’s nature. This iterative process is essential to
ensure that the integration runs smoothly and that both parties are aligned on expectations.
F. FAQs
Find quick answers to the most commonly asked questions about AppNava, including how it works, who it's for, and how to get started. Whether you're a first-time user or looking to troubleshoot setup, this FAQ section is designed to help you get the information you need—fast.
What kind of businesses benefit most from AppNava?
AppNava is ideal for mobile app and game developers looking to understand user behavior, increase retention, and personalize experiences through data-driven decisions and machine learning.
Do I need technical expertise to use AppNava?
No, AppNava is designed to be accessible for non-technical users while still offering powerful tools and integrations for technical teams.
Is AppNava suitable for early-stage startups?
Absolutely! AppNava supports both startups and established companies by simplifying access to predictive insights and actionable analytics.
Can I use AppNava with my existing analytics tools?
Yes, AppNava supports integrations with popular analytics and measurement platforms like AWS, Google Analytics, and GameAnalytics.
How does AppNava personalize user experiences?
AppNava uses machine learning to segment users based on behavior and predicts their future actions, allowing you to customize offers and campaigns accordingly.
What makes AppNava’s predictions reliable?
AppNava’s machine learning models are trained on real player behavior patterns and continuously improved to ensure accurate forecasts and recommendations.
Ensure you provide the Product Name, choose the appropriate Data Location (e.g., BigQuery, AWS, Snowflake, Redshift, or Other) and Dataset Name.
What do I need before enabling the Firebase prediction option?
Make sure you have both the Android/iOS App ID and Secret ID set in your product. Without these, Firebase integration won't be available.
Is backend integration required?
No, it's optional. However, if you're using Firebase or Satori for backend data syncing or analysis, it's strongly recommended to provide the necessary credentials (App ID, Secret ID, Server Key, etc.).
Where do I find the Snowflake or Redshift table names?
You can find them in your Snowflake or Redshift dashboards respectively. Provide the full table name in the format required (e.g., DB.SCHEMA.TABLE for Snowflake).
What if my product uses a different or custom data source?
Choose "Other" from the Data Location dropdown and contact us for support with your integration setup.
Can I invite my team to help manage products?
Yes, go to the Users page in the dashboard and click Invite User. Enter their email and send the invitation.
Where do I start setting up machine learning models?
Begin by going to the Data Operations page on the dashboard and clicking the Start Predicting Models button.
How do I select models for training?
After clicking the button, you'll see a list of available models. Check the models you want to use and assign a tag to the dataset for tracking purposes.
What happens after I click "Done"?
Each selected model will be added as a new entry under the Data Preparation section. Our team will be notified and begin processing your models.
How will I know when my models are ready?
You’ll receive an email notification once your models are successfully trained and ready to use.